Updated November 23, 2023
CAPM Formula (Table of Contents)
CAPM Formula
The linear relationship between the expected return on investment and its systematic risk is represented by the Capital Asset Pricing Model (CAPM) formula.
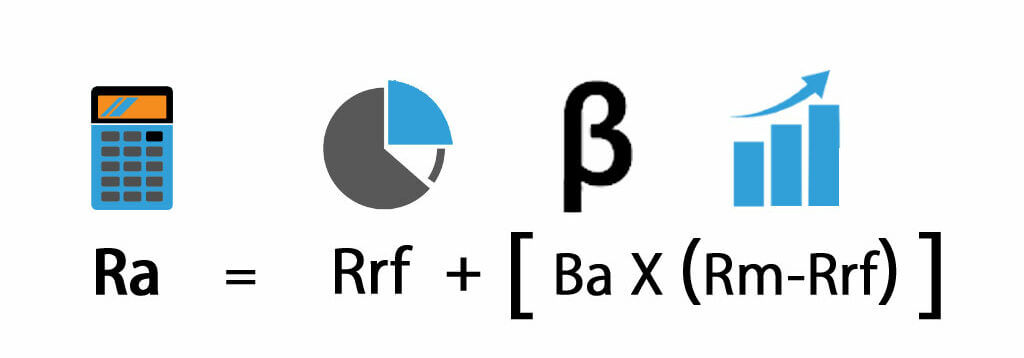
CAPM is calculated according to the below formula:-
![]()
Where:
- Ra = Expected return on an investment
- Rrf = Risk-free rate
- Ba = Beta of the investment
- Rm = Expected return on the market
Risk Premium is the difference between the expected return on the market minus the risk-free rate (Rm – Rrf).
Market Risk Premium
Investors expect a higher reward, known as the market risk premium, to compensate for the risk inherent in investing in the stock market compared to investing in government bonds. Therefore, the expected return on the market and the risk-free rate differ. To estimate the market rate of return, Rm, one can rely on past returns or project future returns. For example, the US treasury bills and bonds are used for the risk-free rate.
Expected Return
The “Ra” refers to the expected return of an investment over a period of time.
Risk-Free Rate
The “Rrf” denotes the risk-free rate, which is equal to the yield on a 10-year US Treasury bill or government bond. The risk-free rate is the return that an investment earns no risk, but in the real world, it includes inflation risk. When planning an investment, it is crucial to consider the risk-free rate of the country where you intend to invest and align the maturity period of the bond with your investment timeline. Typically, when estimating the risk premium, one determines the risk-free rate of return by taking the average of historical risk-free rates of return rather than relying on the current risk-free rate of return.
Beta
The CAPM formula represents Beta as “Ba,” demonstrating how much a security or portfolio’s price fluctuates compared to the overall market’s return. It calculates the investment’s volatility. Beta is a measure of systematic risk. For example, if a company’s Beta is equal to 1.7, it means it has 170% of the volatility of returns of the market average, and the stock price movements will be rather extreme. If the Beta equals 1, then the expected return on investment equals the market average return. If the Beta is -1, then it means the stock prices are less risky and volatile.
Application of the CAPM model
We will see a few examples of CAPM, which is most often used to determine an investment’s fair price. When we calculate the risky asset’s rate of return using CAPM, then that rate can also be used to discount the investment’s future cash flows to their present value and finally arrive at the investment’s fair price.
Examples of CAPM Formula
Let’s take an example to find out the CAPM for a company: –
Example 1
Say that Stock A is expected to bring in returns of 14% over the next year and that the current risk-free rate is 6%, and you want to calculate whether it is profitable to invest in this. You have calculated the stock’s beta value, which is 1.7. The overall stock market has a beta of 1.0. This implies that the stock carries a higher level of risk than the overall risk. Therefore, we expect a higher return than the market’s 14% anticipated return over the next year.
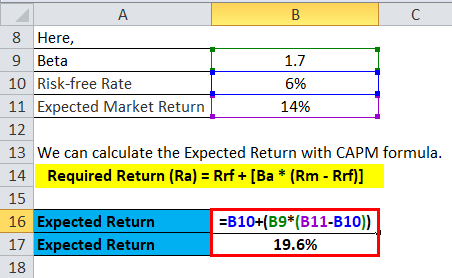
The Expected Return can be calculated as below:
- Required Return (Ra) = Rrf + [Ba * (Rm – Rrf)]
- Required Return (Ra) = 6% + 1.7 * (14% – 6%)
- Required Return (Ra) = 6% + 13.6%
- Required Return (Ra) = 19.6%
This calculation tells you that you will get 19.6 % on your investment.
Example 2
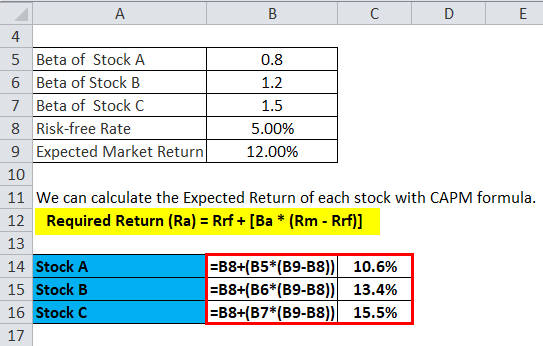
Suppose an investor is thinking of investing in one of the three stocks available in the market. The below information is available to estimate the rate of return of the three stocks.
- Stock A with a beta of 0.80
- Stock B with a beta of 1.20
- Stock C with a beta of 1.50
The risk-free rate is 5.00%, and the expected market return is 12.00%.
We can calculate the Expected Return of each stock with the CAPM formula.
- Required Return (Ra) = Rrf + [Ba * (Rm – Rrf)]
Expected Return of Stock A
- E(RA) = 5.0% + 0.80 * (12.00% – 5.0%)
- E(RA) = 5.0% + 5.6%
- E(RA) = 10.6 %
Expected Return of Stock B
- E(RB) = 5.0% + 1.20 * (12.00% – 5.0%)
- E(RB) = 5.0% + 8.4%
- E(RB) = 13.4 %
Expected Return of Stock C
- E(RC) = 5.0 %+ 1.50 * (12.00% – 5.0%)
- E(RC) = 5.0 % + 10.5%
- E(RC) = 15.5%
Therefore, we see that it is best to invest in stock C. The CAPM formula states that an increase in Beta results in an increase in the expected return.
Example 3
Now, we will see an application problem of expected return. We can calculate the Net Present Value using the expected return or the hurdle rate from the CAPM formula as a discounted rate to estimate the net present value of an investment.
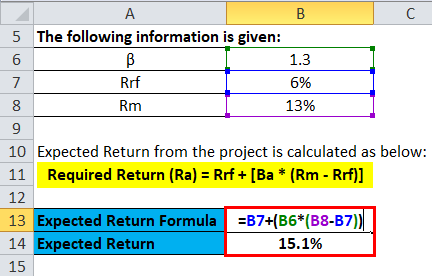
The following information is given:
- β =1.3
- Rrf = 6%
- Rm =13%
So, the hurdle rate or expected return from the project is calculated as below:
- Required Return (Ra) = Rrf + [Ba * (Rm – Rrf)]
- Ra = 6% + 1.3 * (13%- 6%)
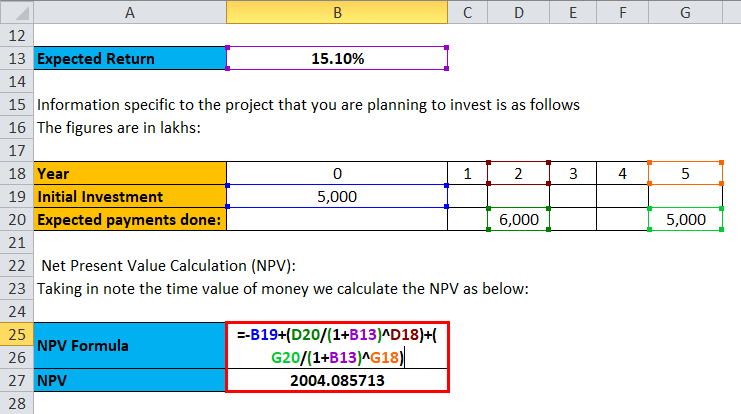
= 6% + 9.1% - Ra = 15.1%
Information specific to the project you plan to invest in is as follows. The figures are in lakhs:
- Initial Investment= ₹5,000
- Expected payments done: ₹ 6,000 in 2nd year, ₹ 5,000 in 5th year
Net Present Value Calculation (NPV): Taking into note the time value of money, we calculate the NPV as below:
NPV= – Initial Investment + Summation of ( Value of Investment/ (1+ Rate)^ No.of Years)
The investor made a first investment of 5,000, followed by a second-year investment of 6,000, and a third investment of 5,000 in the 5th year. Just put the values to get the results.
- NPV = -5,000 +( 6,000/1.151^2 )+ (5000/1.151^5 )
- NPV = ₹ 2004.085713
Therefore, the net value of the investment done is ₹ 2004.085713.
Assumptions of CAPM Formula
- Investors hold diversification across a range of investments, so they eliminate unsystematic risk.
- Investors can lend and borrow any amount under the risk-free rate.
- CAPM considers the market ideal and does not include taxation or transaction costs in an account.
- Assume all information is available at the same time to all investors.
- Every investor is against risk exposure.
Limitations
The limitation of this CAPM formula is the higher the risk of the asset, the greater the expected return, which is not always true.
CAPM Formula Calculator
You can use the following CAPM Calculator
| Rrf (%) | |
| Ba | |
| Rm (%) | |
| Ra | |
| Ra = Rrf + [Ba X (Rm - Rrf)] |
| 0 + [0 X (0 - 0)] = 0 |
CAPM Formula in Excel (With Excel Template)
Here, we will do the same example of the CAPM formula in Excel. It is very easy and simple. You need to provide the three inputs, i.e., Risk-free rate, Beta of the investment, and Expected return on the market.
You can also easily calculate the CAPM using the formula in the template provided.
The Expected Return can be calculated as below:
We can calculate the Expected Return of each stock with the CAPM formula.
The expected return from the project is calculated as below:
The net value of the investment is calculated as follows:
Recommended Articles
This article has been a guide to a CAPM formula. Here, we discuss its uses along with practical examples. We also provide you with a CAPM Calculator with a downloadable Excel template. You may also look at the following articles to learn more –
