Updated July 26, 2023
Definition of Financial Analysis Example
Financial analysis example is the investigation of business results and financial reports with the aim to understand the performance of the entity. The analysis covers the facets of the business’s profitability, liquidity, and solvency.
This, in turn, helps to make decisions about investing, policy, or determining the future state of action. The analysis can take place in corporate finance or investment finance. Corporate finance deals with NPV and IRR calculation of a prospective project. In contrast, investment finance analysis deals with understanding the competitive benefit of investing amongst a slew of competitive firms for an investor.
Examples of Financial Analysis (With Excel Template)
Let’s take an example to understand the calculation of the Financial Analysis in a better manner.
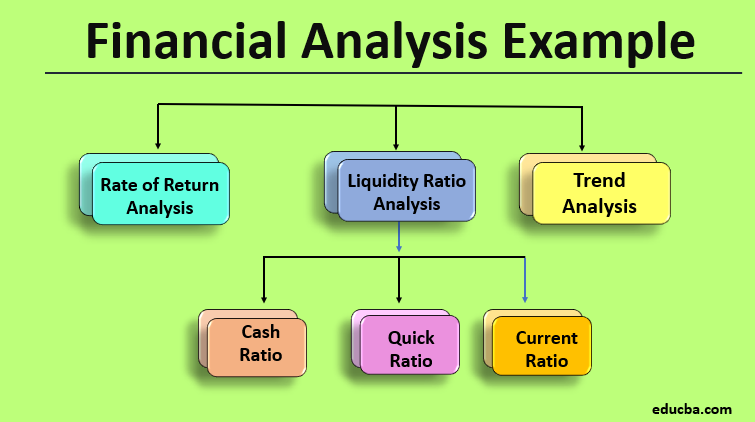
Financial Analysis Example #1 – Liquidity Ratio Analysis
It measures the timeliness an entity could clear out its imminent liabilities. An entity’s creditworthiness depends on the number of liquid assets it possesses. An unfavorable ratio would mean uncertainty regarding the fulfillment of the external liabilities, thereby raising questions about its future.
This ratio analysis, though, should consider the entity’s payment cycle and seasonal fluctuation. For example- if the payment cycle is in progress, the cash with the entity would be low, thereby not giving the correct picture of the financial situation. The ratios could be of the following kinds
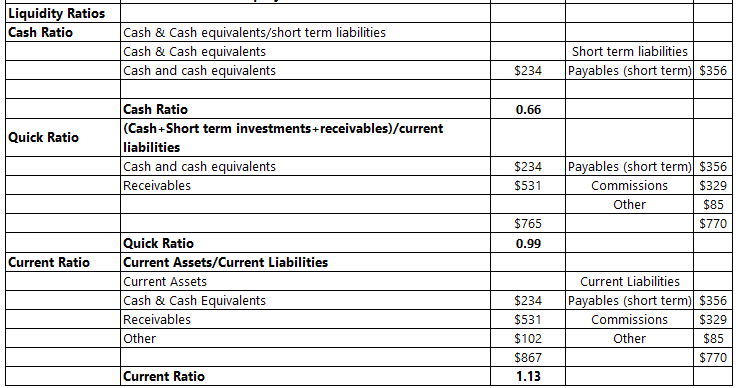
Cash Ratio
- Cash Ratio compares the amount of cash to the immediate short-term liabilities. If the business were to be dissolved today, would the cash be adequate to cover its short-term liabilities at that point?
Quick Ratio
- Quick Ratio is the measure of the cash and the future cash to be received (receivables from debtors) to repay the current liabilities that the firm has. Quick assets include assets that the company can convert into cash within 90 days. This ratio indicates the ability of the firm to cover its liability obligations without resorting to long-term assets. More is the ratio, the better is the ability of the firm to cover itself from foreseeable liabilities
Current Ratio
- It measures a firm’s current assets against the payment of the current liabilities. Here, the term “current” refers to assets the company will convert into cash within the next year or assets due to be repaid within the next year. It is one of the most important ratios to look at the liquidity ability of the concern.
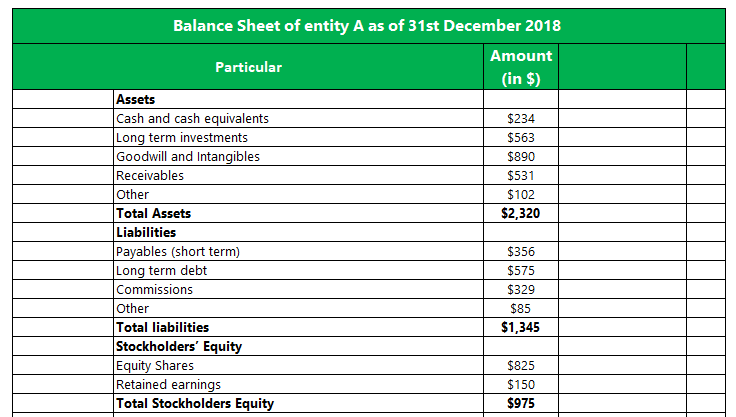
The below example looks at Entity A and the determination of the liquidity ratios for a particular point in time:
Financial Analysis Example #2 – Trend Analysis
This tool plots a given variable’s performance over time to find out the various features, predict the future course of action, and weave methods around it, considering such a trend to continue in the near future.
For example: if the profit of concern is decreasing yearly by around 5%, there is a cause to check the factors influencing such movement. It could be due to external factors like changes in market conditions or could be driven by internal situations like cost increases or decreases in revenue. First, the trend analysis will tell us the cause and then indicate if such a move would continue. After analyzing the situation, it has been determined that internal factors have minimal influence on the movement and are outside of the firm’s control. In this case, the company must minimize the unfavorable movement. This could involve expenditures on certain new assets and/or change the existing processes.
Generally, trend analysis is depicted by line graphs, a good visual medium to understand the changes happening over time.
Financial Analysis Example #3 – Rate of Return Analysis
In the capital purchase decision-making process, the rate of return is commonly used to measure the increase in returns that the new asset will provide over the cost incurred. This analysis can be performed in two stages.
Pre-purchase: This would indicate the expected returns that an asset would bring over a period of time. If the returns are more than the cost incurred discounting at a decided rate of return, then it is worth investing in the asset.
Post-purchase: After the asset is utilized in production, the management might want to do a post facto analysis of how the asset is yielding and compare it to the expectation that they might initially have from the asset. If the yield is not up to the mark, the management could probably decide to sell it at the current market price and develop an alternative solution that could help create better returns.
Conclusion
Financial analysis holds significant importance in decision-making for both management and potential investors. It helps them understand the current health of the entity and facilitates the comparison of entities within the same industry. Furthermore, it allows for creating future forecasts that aid management in making decisions.
However, it is crucial to note that the analysis’s validity is subject to the timing of its execution. An entity’s temporary crisis can skew the analysis unfavorably during that period. Additionally, past performance does not necessarily serve as the best indicator of future performance. Therefore, decision-makers must exercise caution when interpreting financial analysis results, considering the contextual factors and potential changes in the business environment that may arise in the future.
Recommended Articles
This is a guide to the Financial Analysis Example. Here we discuss the introduction and practical example of liquidity ratio analysis, trend analysis, rate of return analysis, detailed explanation, and downloadable Excel template. You can also go through our other suggested articles to learn more –

