PE Ratio Formula (Table of Contents)
Price to Earning Ratio Formula
Here’s the PE Ratio formula –
PE of Index = Summation of Market Cap of companies comprising the index / Summation of earnings of companies comprising the index
Examples of PE Ratio Formula
Let’s take the example of Apple Inc. to Calculate PE Ratio Using Formula
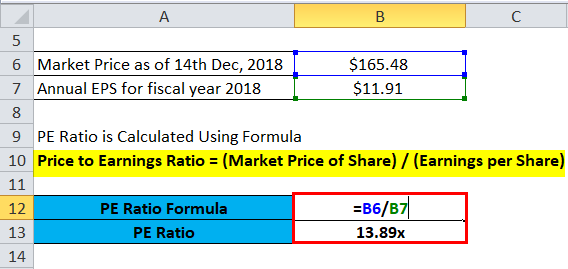
Price per share as of December 14, 2018, ~ $165.48
Annual Earnings per share for the year ended Sept 30, 2018 = $11.91
PE Ratio is Calculated Using Formula
- PE Ratio = (Market Price of Share) / (Earnings per Share)
- PE = 165.48/11.91
- PE = 13.89x
Explanation
1. What is the PE Ratio Formula?
– Price to Earnings (PE) is one of the most popular ratios formulae investors use for valuing companies and making investment decisions. It may be interpreted as the amount investors are willing to pay to receive one unit of earnings. Considering the Apple example, you would have to pay $13.89 for every dollar of earnings from Apple. In other terms, if Apple’s earnings and share price remain stable at the current level, it needs any investor 13.9 years to recover the share price paid today.
2. Breaking Down the PE Ratio Formula
PE does not have much relevance in isolation but needs to be compared across time/companies to make informed decisions. But for that comparison to be uniform, we may need to adjust price and earnings for anomalies like stock splits, one-time gains/losses, dilution effect from convertibles and options, price volatility, etc. For example, take Tata Power Ltd.’s FY17-18 financials, which disclosed a loss from discontinued operations of Rs 71.74 cr; we need to consider trailing PE (based on the price of Dec 14, 2018, and earnings of the previous fiscal) of 8.33x, which excludes this loss rather than the PE of 8.11x which includes this loss.
3. Trailing PE vs Forward PE
Trailing PE is calculated using actual earnings per share over a specified previous time period. Forward PE uses projected earnings per share in its calculation. Trailing PE is more reliable, while forward PE could be misleading if estimates are faulty. This section can be deleted: When people talk about PE, it usually trails PE.
For example, assuming Apple’s earnings growth rate of 11.57% next year (analyst forecast from Nasdaq), forward PE as of Dec 14, 2018, would be 12.45x. For a growing company, the forward PE would be lower than the trailing PE.
- PE of Index– PE of stock indexes gives an indication of the health of the market representing the index and the future direction of the stock prices. When the index rises faster than the earnings of the companies comprising the index, PE expansion occurs and vice versa. For example, the Sensex PE touched a high of 29 during the dot-com bubble and a low of 12 during the subprime crisis, representing India’s overpriced and underpriced stock market.
- Earnings yield– Earnings yield is the reciprocal of the PE ratio, e. Earnings per share / Price per share. So, Apple has an earnings yield of 7% based on the above calculation, meaning every dollar invested would generate EPS of 7 cents. The earnings yield of companies is useful when compared with the yields of bonds.
- Modified PE– Investors can also use a modified version of PE by using free cash flow per share instead of earnings in the denominator and adjusting for accounting issues, net debt repayments, and capital expenditure the company needs to continue the operations and expected growth.
Significance and Use of Price to Earning Ratio Formula
1. Relative Valuation
PE standardizes stocks across different prices and earnings and is a good indicator for identifying overpriced and underpriced stock through comparison across time and peers. Overpriced and underpriced markets/sectors can also be located through this ratio.
For example, consider the following table.
| Microsoft | Apple | Kraft Foods | |
| Trailing PE | 44.0x | 13.9x | 5.6x |
| Forward PE (1 yr) | 24.7x | 12.8x | 13.3x |
| Expected earnings growth (5 yr) | 12.5% | 10.4% | 6.2% |
(Image Source: Nasdaq)
At an initial glance, Apple looks more attractive than Microsoft, considering forward PE. However, the forward PE calculations consider the high growth estimate of analysts’ earnings in the case of Microsoft. We cannot compare the PE of Microsoft or Apple with Kraft Foods since it’s a different business with different drivers.
2. High PE and Low PE
While we usually interpret high PE as expensive and low PE as attractive stock, no magic number demarcates high and low PE. The normal range for PE could be quite different across industries based on differing expectations. Hence, comparing the PE of companies from different industries would be wrong. For example, the technology companies may witness an average PE of around 20, backed by high growth rates and high return of equity vis-à-vis textile companies witnessing a PE of 8.
3. Small-cap and Large-cap Stocks
Small-cap stocks have usually remained attractive due to relatively faster earnings growth. It’s easier for a small company to double its size than a large one. Accordingly, the PE of small caps is usually higher, trading at a premium compared to large caps.
4. Growth and Value Stocks
Growth stocks generally have relatively high PE compared to value stocks due to the bullish expectations of investors regarding a high growth rate of future earnings. Value stocks are assumed to be underpriced in the market compared to their intrinsic value as perceived by the investor and hence have low PE. You may witness growth stocks in high-growth industries like pharma, while you may find value stocks in the financial industry or commodity producers priced at low valuations.
5. Limitations in Computation
PE allows manipulation since company management can fudge earnings reports for better valuations. Hence, EPS calculations must be monitored closely and adjusted for uniformity in comparison. Furthermore, PE fluctuations would occur due to price fluctuations; hence, it is advisable to use the average price over a period of time for PE computation. For companies with zero or negative earnings, the PE ratio formula is useless, like in the case of Tesla Inc., with trailing 12 months EPS of -$10.67. In such cases, relative valuation can be done through multiples like EV/EBITDA or P/S.
6. Limitation in Interpretation (Leverage and Growth)
PE ratio does not account for the impact of debt on valuation and performance. A high-debt company may exhibit an attractive PE but may also exhibit higher volatility in earnings. A better metric would be EV/EBITDA when comparing companies with different degrees of financial leverage, like in the case of the utility sector. PE also does not say anything about the growth prospects of a company. A more useful measure to compare firms with different growth rates would be the PEG ratio, which is PE divided by the earnings growth rate for a specified time period.
Price to Earning Ratio Calculator
You can use the following PE Ratio Calculator
| Market Price of Share | |
| Earnings per Share | |
| Price to Earnings Ratio= | |
| Price to Earnings Ratio= | = |
|
|
Price to Earning Ratio Formula in Excel (With Excel Template)
Here, we will do the same example of the PE Ratio formula in Excel. It is very easy and simple. You need to provide the two inputs i.e. Market Price of Share and Earnings per Share
You can easily calculate the PE Ratio using Formula in the template provided.
PE Ratio of Apple Inc. is Calculated Using the Below Formula
- PE Ratio = $165.48 / $11.91
- PE Ratio = 13.89x
Recommended Articles
This has been a guide to the Price to Earning Ratio formula. Here, we discuss its uses along with practical examples. We also provide a PE Ratio Calculator with a downloadable Excel template. You may also look at the following articles to learn more –
