Updated July 31, 2023
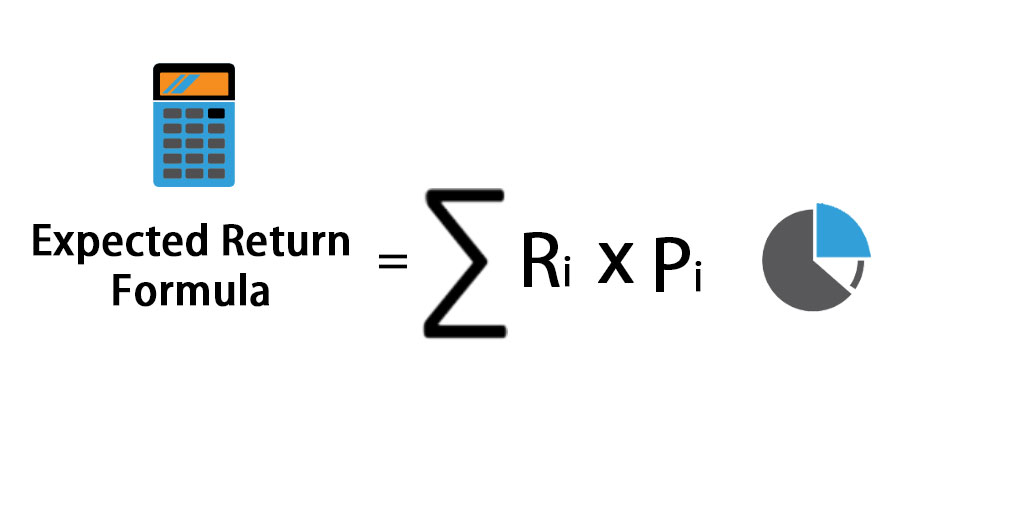
Expected Return Formula
Expected Return can be defined as the probable return for a portfolio held by investors based on past returns, or it can also be defined as an expected value of the portfolio based on the probability distribution of probable returns.
Here’s the Expected Return Formula –
Where
- Ri – Return Expectation of each scenario
- Pi – Probability of the return in that scenario
- i – Possible Scenarios extending from 1 to n
Examples of Expected Return Formula (With Excel Template)
Let’s take an example to understand the calculation of the Expected Return formula in a better manner.
Expected Return Formula – Example #1
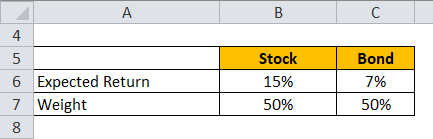
Let’s take an example of a portfolio of stocks and bonds where stocks have a 50% weight and bonds weight 50%. The expected return on stocks is 15%, and the expected return for bonds is 7%.
Expected Return is calculated using the formula given below
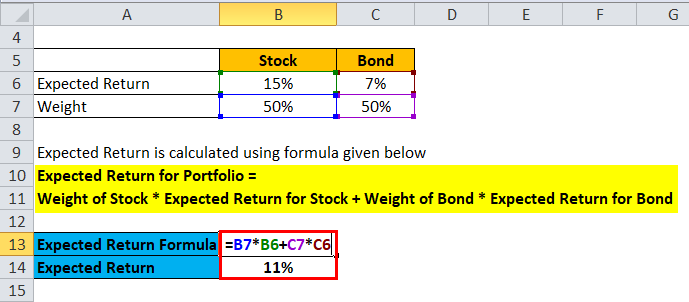
- Expected Return for Portfolio = 50% * 15% + 50% * 7%
- Expected Return for Portfolio = 7.5% + 3.5%
- Expected Return for Portfolio = 11%
Expected Return Formula – Example #2
Let’s take an example of a portfolio which has stock Reliance, Tata Steel, Eicher Motors and ITC.
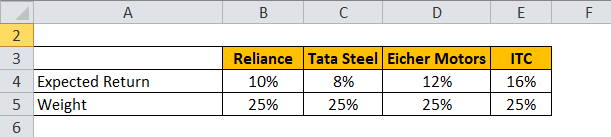
Expected Return is calculated using the formula given below
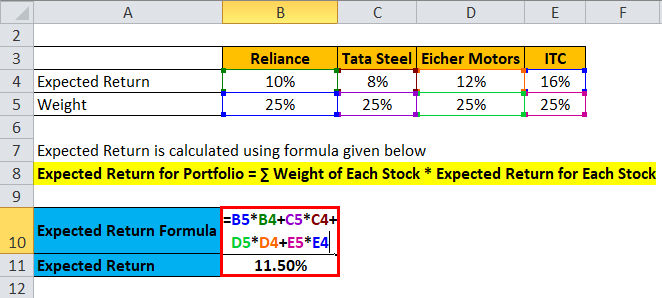
- Expected Return for Portfolio = 25% * 10% + 25%* 8% + 25% * 12% + 25% * 16%
- Expected Return for Portfolio = 2.5% + 2% + 3% + 4%
- Expected Return for Portfolio = 11.5%
Expected Return Formula – Example #3
Let’s take an example of a portfolio of HUL, HDFC, and 10-year government bonds.
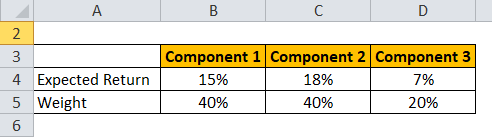
Expected Return is calculated using the formula given below
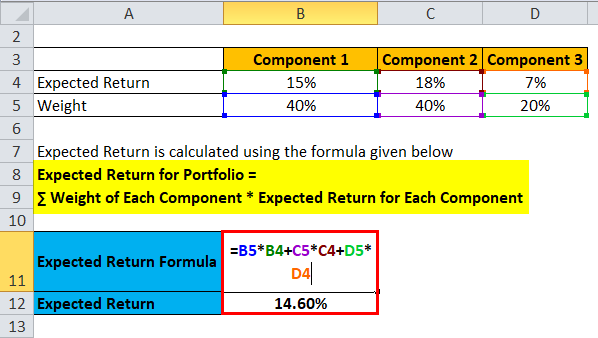
- Expected Return for Portfolio = 40% * 15% + 40% * 18% + 20% * 7%
- Expected Return for Portfolio = 6% + 7.2% + 1.40%
- Expected Return for Portfolio = 14.60%
You can download this Expected Return Formula Excel Template here – Expected Return Formula Excel Template
Explanation of Expected Return Formula
Investors define the expected return as the probable return for a portfolio based on past returns or as the expected value of the portfolio derived from a probability distribution of probable returns. In the short term, the expected return represents a random variable that takes different values based on distinct probabilities. This random variable has values within a certain range and can only assume values within that particular range. Therefore, calculating the expected return relies on historical data and may not be reliable for forecasting future returns. It measures various probabilities, the likelihood of achieving a positive return on investment, and the value of that return.
This aims to give an investor an idea of a different level of risk and the various scenarios with different probabilities that will yield a return possibly greater than the risk-free return. As we all know, the risk-free return would be the 10-year Treasury bond yield of the United States Government.
Relevance and Uses of Expected Return Formula
As mentioned above, the Expected Return calculation is based on historical data, so it is limited in forecasting future possible returns. Investors must consider various other factors and not invest based on the calculated expected return. Take an example: –
Portfolio A – 10%, 12%, -9%, 2%, 25%
Portfolio B – 9%, 7%, 6%, 6%, 12%
If we consider both the above portfolios, both have an expected return of 8% but Portfolio A exhibits a lot of risk due to a lot of variance in returns. Investors must consider this risk, calculated by measuring Standard Deviation and Variance.
- Variance- can be defined as a variation of a set of data points around their mean value. The probability-weighted average of squared deviations from the mean calculates it. It is a measure of risk that needs to be taken into account by investors.
First, calculate the mean of all returns. Then, find each return’s deviation from the mean value and square it to ensure all positive results. Once squared, multiply the squared deviations by their respective probability values to determine the variance.
Portfolio variance can be calculated from the following formula: – If there are two portfolios, A and B.
Portfolio Variance = wA2 * σA2 + wB2 * σB2 + 2 * wA * wB * Cov (A, B)
Where Cov (A, B) – is the covariance of portfolios A and B
- Standard Deviation – It is another measure that denotes the deviation from its mean. Standard deviation is calculated by taking a square root of the variance and denoted by σ.
Expected Return Formula Calculator
You can use the following Expected Return Calculator.
| R1 | |
| P1 | |
| R2 | |
| P2 | |
| R3 | |
| P3 | |
| R4 | |
| P4 | |
| Expected Return | |
| Expected Return = | R1*P1 + R2*P2 + R3*P3 + R4*P4 | |
| 0 * 0 + 0 * 0 + 0 * 0 + 0 * 0 = | 0 |
Conclusion
Investors should not solely consider the expected return, defined as the probable return for a portfolio based on past returns, when deciding whether to invest. The limitations arise from its reliance on past returns. Instead, investors must examine other measures, such as the portfolio’s variance and standard deviation.
Recommended Articles
This has been a guide to the Expected Return formula. Here we discuss How to Calculate Expected Return along with practical examples. We also provide an Expected Return Calculator with a downloadable Excel template. You may also look at the following articles to learn more –
