Difference Between Visual Analytics vs Tableau
Today’s business needs more efficient and easily used business intelligence tools to achieve their goals and gain more profit. Installing a new business intelligence tool takes several weeks, months, or even years, and the maintenance of the device is also expensive. Here are the two most popular BI tools, Visual Analytics vs. Tableau, and their features and comparison.
Head to Head Difference Between Visual Analytics vs Tableau (Infographics)
Following are some of the differences listed below.
What is Visual Analytics?
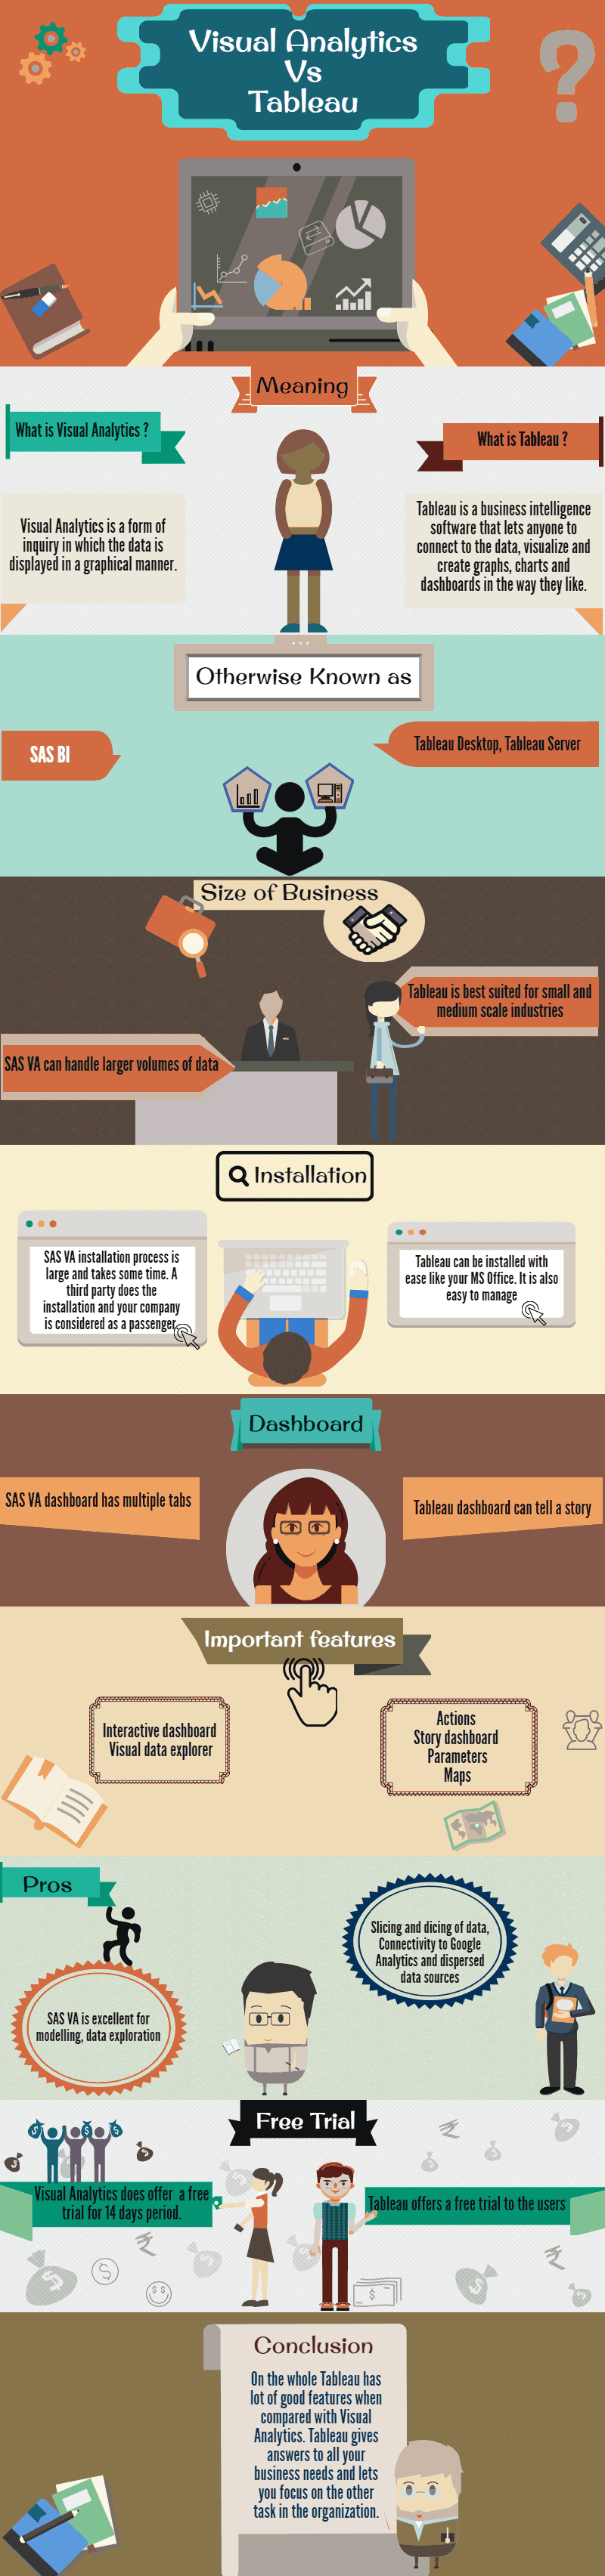
Visual Analytics is a form of inquiry in which the data is displayed graphically. Visual Analytics is a combination of automated analysis techniques with interactive visualizations for the purpose of effective understanding, reasoning, and decision-making. This is mostly used in very large and complex data sets. Visual Analytics is an in-memory visualization and reporting tool.
Goals of Visual Analytics
The goals of visual analytics are as follows.
- Provide a transparent way of processing data and information for an analytic discourse.
- Integrate scientific disciplines to improve the division of work between humans and machines.
- Gain in-depth knowledge from large, dynamic, and complex data
- Helps to provide more understandable, timely, and defensible reports
- Communicate the report effectively so that proper decisions are taken
Visual analytics does more than just visualization. The main task in visual analytics is to identify the best algorithm for the task at hand and develop the best solution with proper visualization and interaction techniques.
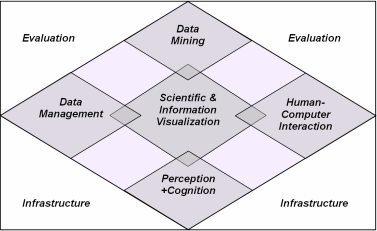
Areas related to Visual Analytics
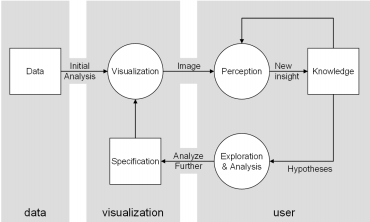
Visual Analytics Process
SAS Visual Analytics
SAS Visual Analytics is a deep analytics portfolio that was launched by SAS in the year 2012. It is the most sophisticated visual analytics platform and best suits larger companies with complex needs. SAS VA is a complete analytics visualization platform that will help you find patterns and relationships in data. It has a powerful in-memory technology for quicker analytic computations. It is easier to use and has a self-service environment that can handle large amounts of data.
SAS VA helps you to unlock insights and improve efficiency throughout the organization. It reduces the work of the IT department and lets them concentrate on the business’s goals. Visual Analytics in SAS is the best way to tell your Business Intelligence story. It is priced higher than other visual analytic software comparisons but has many good features and functionalities. It has a traditional Business Intelligence platform, requiring skilled persons to use it.
SAS Visual Analytics is compared with Tableau, TIBCO Spotfire, and others.
Features of SAS VA
Following are some of the features given.
- Innovative visualization techniques
- Visual data exploration
- Self-service, easy analytics
- Robust report design
- Mobile Business Intelligence
- Collaboration
- Easy data administration
- Deployment flexibility
- Auto charting
- More interactive dashboards and reports
- Mapping technologies
- Text sentiment analysis
Benefits of SAS VA
Following are some of the benefits given.
- You can implement visual analytics dashboards, reporting, and analytics from a single interface.
- You can view and interact with the reports and dashboards from your smartphone or any such device through Mobile BI apps.
- Visual Analytics in SAS allows you to share visualizations through MS Office applications like Excel and PowerPoint.
- Visual Analytics in SAS uses various optical analytics techniques that will help you present the data more attractively.
- You can choose a Business Intelligence implementation that fits your business need. You can also expand it as your business grows. You also have the option to use BI in a private cloud or a public cloud.
What is Tableau?
Tableau is a business intelligence software that lets anyone connect to the data, visualize and create graphs, charts, and dashboards in the way they like. It is an exploration software. Tableau’s desktop can perform its analysis. It helps the business to analyze a large amount of data in a quick and user-friendly way.
This is the more popular software that is most preferred by business people for data visualization.
Features of Tableau
This has five essential features.
- Tableau Desktop – This has an attractive drag-and-drop desktop, which lets the users quickly analyze, sort, and visualize data.
- Tableau Server – This server communicates the visualizations to any device, like a desktop or mobile, that supports a web browser. The architecture of the Tableau server is measurable.
- Tableau Online – Tableau online features let users share the dashboards with their partners as well as the customers
- Tableau Reader – This feature lets the user share the data visualization created using this software.
- Tableau Public – The website enhancement feature lets the visualization narrate the story.
Features of the new version of Tableau
- Statistical data files – This already supports more data sources, and the new version of it supports statistical files.
- Data preparation – The new version of this has more data preparation features which help the users to clean the data and spend more time on analysis.
- Ad Hoc Calculations – The new version allows the users to perform many calculations on an Ad Hoc basis. Tableau gives you answers on the flow, letting you experiment with new things.
- Query Performance Improvement – In the new version of Tableau, the in-memory analytic database works even faster. It is designed to make the most use of the user’s hardware.
A new technology called Query Fusion has been added, which will search for all the queries and look for ways to simplify them.
- Innovative Maps – Selection controls, Location search capability are all the new features introduced in the latest version.
- Admin Views – Admin views are one more unique feature added to the new version, which lets the administrators monitor and analyze data quickly. It also enables them to detect bugs, plan upgrades, and track activities.
There are also several other features of Tableau, which are divided into three categories.
Analytics Features
- Ad Hoc Analysis
- OLAP
- Predictive Analysis
- Trend Indicators
Reporting Features
- Ad Hoc Reporting
- Automatic Scheduled Reporting
- Customizable dashboard
- Dashboard
- Financial Forecast
- Graphic Benchmark tools
- Multiple Languages
Support Features
- In-Person Training
- Online Chat
- Phone
- Visual Analytics Tutorials
Some features are provided at a cost, while others come for free. This has all the necessary features you need for your business today and the capabilities you want for tomorrow.
Installation of Tableau is straightforward.
Comparison Table Between SAS Visual Analytics vs Tableau
Here in this article, we are going to compare SAS Visual Analytics vs Tableau.
| Basis of Distinction | SAS Visual Analytics | Tableau |
| Otherwise Known as | SAS BI | Tableau Desktop, Tableau Server |
| Ranking | Ranks 11th position in the BI software tools | Ranks 1st position |
| Few Customers | Staples, Scotia Bank, Australian Institute of Health and Welfare | Accenture, Coco-Cola, Bank of America, PayPal, Google, Skype, Citigroup, Dell, Walmart, The New York Times, US Army and Air force |
| ETL development | Supports internal ETL development | This does not support ETL development |
| Modeling Add-in | SAS VA comes with SAS Visual statistics, which will help you to do modeling | Does not support modeling Add-in |
| Functionality support | In SAS VA, there is a “Stored Process” system where if any functionality is not working, then it can be programmed to do anything literally. | Tableau is dragged and drop tool, and if any functionality is not working, your work gets stopped there. |
| Size of Business | SAS VA can handle larger volumes of data | This is best suited for small and medium-scale industries |
| Installation | THE SAS VA installation process is large and takes some time. A third party does the installation, and your company is considered as a passenger. | This can be installed with ease, like your MS Office. It is also easy to manage. |
| Forms of analysis | SAS VA supports many forms of analysis | Whereas Tableau does not support different types of analysis like text analysis, predictive analysis, what-if analysis, and others |
| Capability | SAS VA requires extra effort and cost to expand the capability | This comes with all the in-built capabilities for business users. |
| Visualization | SAS VA does not support packet bubble visualization | Tableau has packet bubble visualization |
| Color differentiation | SAS VA output cannot be differentiated using colors | In Tableau output, different sectors can be differentiated using different colors |
| Underlying data | In SAS VA, the underlying data cannot be viewed unless you have a Visual data builder or report designer. | On the Tableau desktop, the underlying data can be easily viewed |
| Dashboard | SAS visual analytics dashboard has multiple tabs | Tableau dashboard can tell a story |
| Important features | Interactive dashboard, Visual data explorer | Actions, Story dashboard, Parameters, Maps |
| Deployment Issues | Only minimal deployment issues detected | No deployment issues detected |
| Pros | SAS VA is excellent for modeling, data exploration | Slicing and dicing of data, Connectivity to Google Analytics, and dispersed data sources |
| Recommended improvements | Navigation should be made easy and need to be little cheapAccommodate survey data. | The release of new features is always in the next version, which takes time. |
| Usability | SAS visual analytics has a user guide that will help the users to learn all the basic capabilities | This is very simple and easy to learn. It is a drag-and-drop tool and so users can easily learn it. |
| Support | SAS VA lends legendary support from customer services as well as from analytics experts and representatives | Support is not required in Tableau as it is frequently updated, and the issues are solved quickly. |
| Training | SAS has many regional and national level centers to provide training in order to expand the user’s knowledge about the software | This software is so easy to use, and so it trains a lot of people in a short period of time. Simple instructions are more than enough for the users to understand the new features added. |
| Online help | There are a lot of videos available online for users, which include live classes and resource materials. | Online videos are exceptionally good in Tableau |
| Performance | SAS VA can handle billions of rows of data, and the performance is relatively good | It performs very well. But the only thing is that the data should be organized properly in order to get the maximum performance out of it. |
| Alternatives | SAS VA can get data from other sources such as Salesforce and many others | Alternative solutions are still in the process |
| Initial Setup | The initial setup of SAS VA requires more time and effort | This is easy to install and set up |
| Cost and Licensing | Annual License and the one-time cost | The cost of tableau differs for each of its features |
| Return on Investment | Increase the return on investment through marketing campaigns | Increases productivity and Increases client satisfaction |
| Technical support | SAS VA offers excellent technical support | Do not need any technical support in Tableau |
| Customer Service | The customer intelligence manager and the support team interact closely with the users. | Customer support is very good, but often it is not needed because of the robustness of the software. |
| Google Analytics Connector | SAS VA does not support this feature | Tableau connects easily with Visual Google Analytics |
| Free Trial | Free Visual Analytics trial is available for 14 days. Click here | This offers a free trial to the users |
| Sharing of work | SAS VA lets you share your work with partners and colleagues | It does not let you share your work |
| Themes | In SAS VA, corporate themes can be integrated once it is installed | Tableau does not support any change in themes |
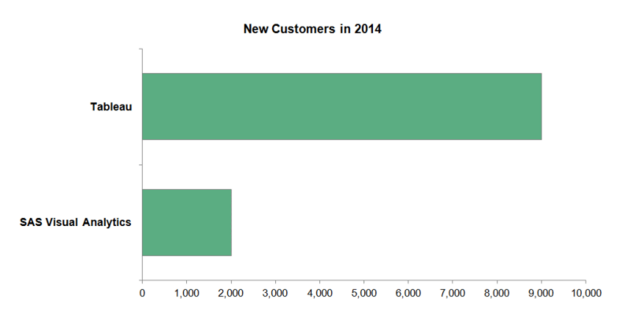
Below is the picture that compares Tableau with SAS VA for the year 2014.
Conclusion
I hope this article has helped you learn the differences between Visual Analytics and Tableau. On the whole, Tableau has a lot of good features when compared with Visual Analytics. Tableau answers all your business needs and lets you focus on the other task in the organization.
Recommended Articles
We hope that this EDUCBA information on “Visual Analytics vs Tableau” was beneficial to you. You can view EDUCBA’s recommended articles for more information.
