
Differences between Tableau vs Domo
Tableau is a Data Visualization champion with a self-service data discovery feature. Tableau covers analytics features like data discovery, data visualization, survey analysis, time-series analysis, social analytics, etc. In order to provide mobile BI solutions, tableau also integrates with R statistical programming language. Domo analyzes as well as cleanse customer data from any source. It makes extract transform and load process easier respectively so that you can analyze data without any SQL training. It has a Data Fusion feature to merge data from multiple data sources. Domo is a cloud-based dashboard that provides a variety of visualization with lower pricing. Thus, domo is proving itself to be a good competitor of Tableau.
Let us compare these two systems based on their features and capability.
Head to Head Comparison Between Tableau and Domo (Infographics)
Below are the top 9 differences between Tableau and Domo:
Key Differences Between Tableau and Domo
Both Tableau and Domo are popular choices in the market; let us discuss some of the major differences between Tableau and Domo:
1. Dashboard
Tableau provides features like custom filters and drag-drop functionality which helps the user to create interactive dashboards and share them with the help of Tableau online or server. Some users find tableau interface not so intuitive.
Domo provides a more pleasant user experience with a number of pre-built pages that can self-assemble based on data inputs or a user can drag-drop them if required.
2. Analytics Capability
Tableau provides the functionality to adopt local processing power and synchronize data quickly. This is also referred to as In-memory and In-database analytics architecture. It also covers analytics features like data discovery, data visualization, survey analysis, time-series analysis, social analytics, etc.
Domo has Data Fusion features to merge data from multiple data sources. Domo does all its processing in a cloud by collecting data from any data source. Domo has the capability to analyze as well as cleanse customer data from any source. It also makes the extraction, transformation, and loading process easier since you can analyze data without any SQL training.
3. Data Connectors
Both Tableau and Domo provide data connectors to connect with multiple sources, thus there is no need to perform any custom configuration or write any code.
4. Operating System
In terms of c, Tableau can work with both Windows and Macintosh OS environments.
Domo also works with both including Windows mobile.
5. Communication
Tableau provides communication in both ways: on-premise as well as cloud-based with Tableau Desktop and Tableau cloud.
Domo Does not provide on-premise communication.
6. Offline Analysis
Tableau provides offline analysis feature when there is no need for internet connectivity.
Domo does not give provision of offline analysis.
7. Data Sources
Tableau provides support to extract data from various kinds of data sources.
Domo provides good support to analyze data obtained from various data sources.
8. Data Extraction
Data extraction process is very easy with a tableau.
Data extraction with Domo is little cumbersome.
9. Speed
Tableau has the capability of quick data analysis by providing two ways of data collection: In-memory connection and live connection.
On the other hand, Domo provides a One-click application and workbench, to connect with different on-premise tools and upload data without any help from IT staff.
10. Real-Time Analysis
Tableau creates a link to dynamic data sources for real-time analysis.
Domo also performs real-time analysis and it also has good social media collaboration.
Tableau and Domo Comparison Table
Below are the lists of points, describe the comparisons Between Tableau and Domo.
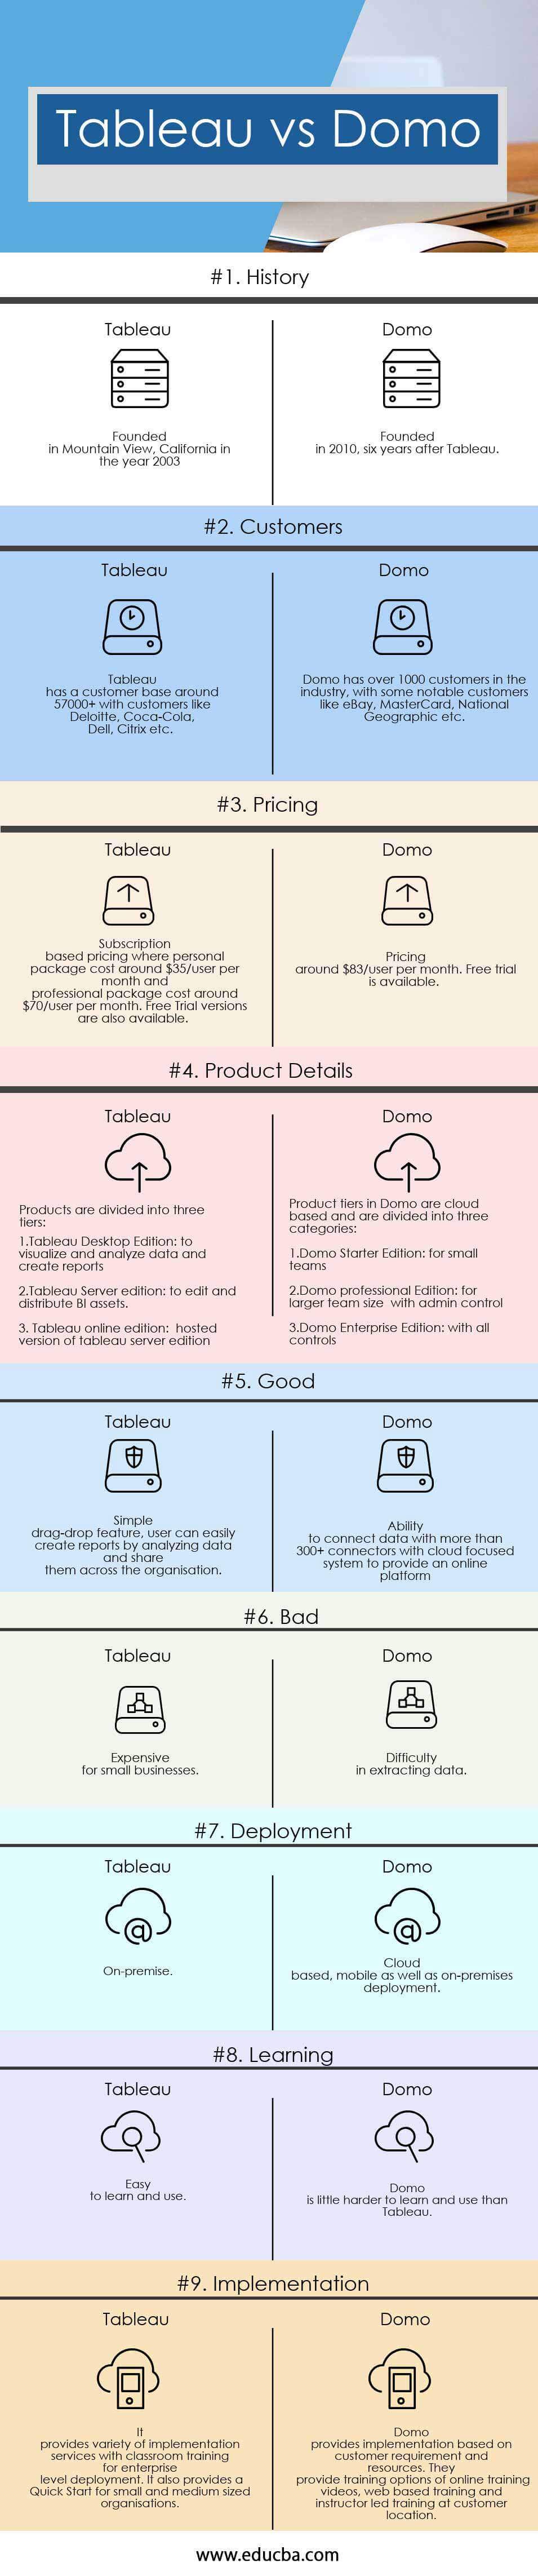
| Basis of Comparison | Tableau | Domo |
| History | Founded in Mountain View, California in the year 2003 | Founded in 2010, six years after Tableau |
| Customers | Tableau has a customer base around 57000+ with customers like Deloitte, Coca-Cola, Dell, Citrix etc | Domo has over 1000 customers in the industry, with some notable customers like eBay, MasterCard, National Geographic etc. |
| Pricing | Subscription-based pricing where personal package cost around $35/user per month and professional package cost around $70/user per month. Free Trial versions are also available. | Pricing around $83/user per month. A free trial is available. |
| Product Details | Products are divided into three tiers: 1. Tableau Desktop Edition: to visualize and analyze data and create reports
2. Tableau Server edition: to edit and distribute BI assets. 3. Tableau online edition: a hosted version of Tableau server edition |
Product tiers in Domo are cloud-based and are divided into three categories:
1. Domo Starter Edition: for small teams 2. Domo professional Edition: for larger team size with admin control 3. Domo Enterprise Edition: with all controls |
| Good | Simple drag-drop feature, a user can easily create reports by analyzing data and share them across the organization. | Ability to connect data with more than 300+ connectors with a cloud-focused system to provide an online platform |
| Bad | Expensive for small businesses | Difficulty in extracting data |
| Deployment | On-premise | Cloud-based, mobile as well as on-premises deployment |
| Learning | Easy to learn and use | Domo is little harder to learn and use than Tableau |
| Implementation | It provides a variety of implementation services with classroom training for enterprise-level deployment. It also provides a Quick Start for small and medium-sized organisations. | Domo provides an implementation based on customer requirement and resources. They provide training options for online training videos, web-based training, and instructor-led training at a customer location. |
Conclusion
Taking into account all the features of Tableau and Domo we can say that both tools allow the same task of mining data for business and data visualization for better analysis and decision making. Both offer many data connectors for horizontal integration and have user-friendly dashboards with intuitive features. Both Tableau and Domo also offer mobile apps. However, the biggest difference is in terms of pricing. If you want to go for Cloud-based application and share access among the whole team, go for Domo. It is more affordable than Tableau in terms of cost. If you want to provide desktop access to few power users, you can choose tableau.
There is no winner in the comparison since both these tools are good enough to provide services required by any organisation. Thus, depending on your need, you can make a choice by considering features of both these Business Intelligence tools.
Recommended Articles
This has been a guide to Differences Between Tableau vs Domo. Here we also discuss Tableau vs Domo head to head comparison, key differences along with infographics and comparison table. You may also look at the following articles to learn more –
