Updated October 25, 2023
The image above is the perfect example of how a Stock market works. Analyze it properly, and you will understand what led to “Buy calls” and “Sell Calls.” It is funny how people can communicate and interpret information! These people do not understand how the stock market works. But the people who know how it works have tools of their own. They carry out all kinds of analyses to come to a particular decision. One of the tools traders and investors worldwide use is the “Stock market indicator.” So, let’s understand what all the fuss is about!
What is a Technical Analysis Indicator?
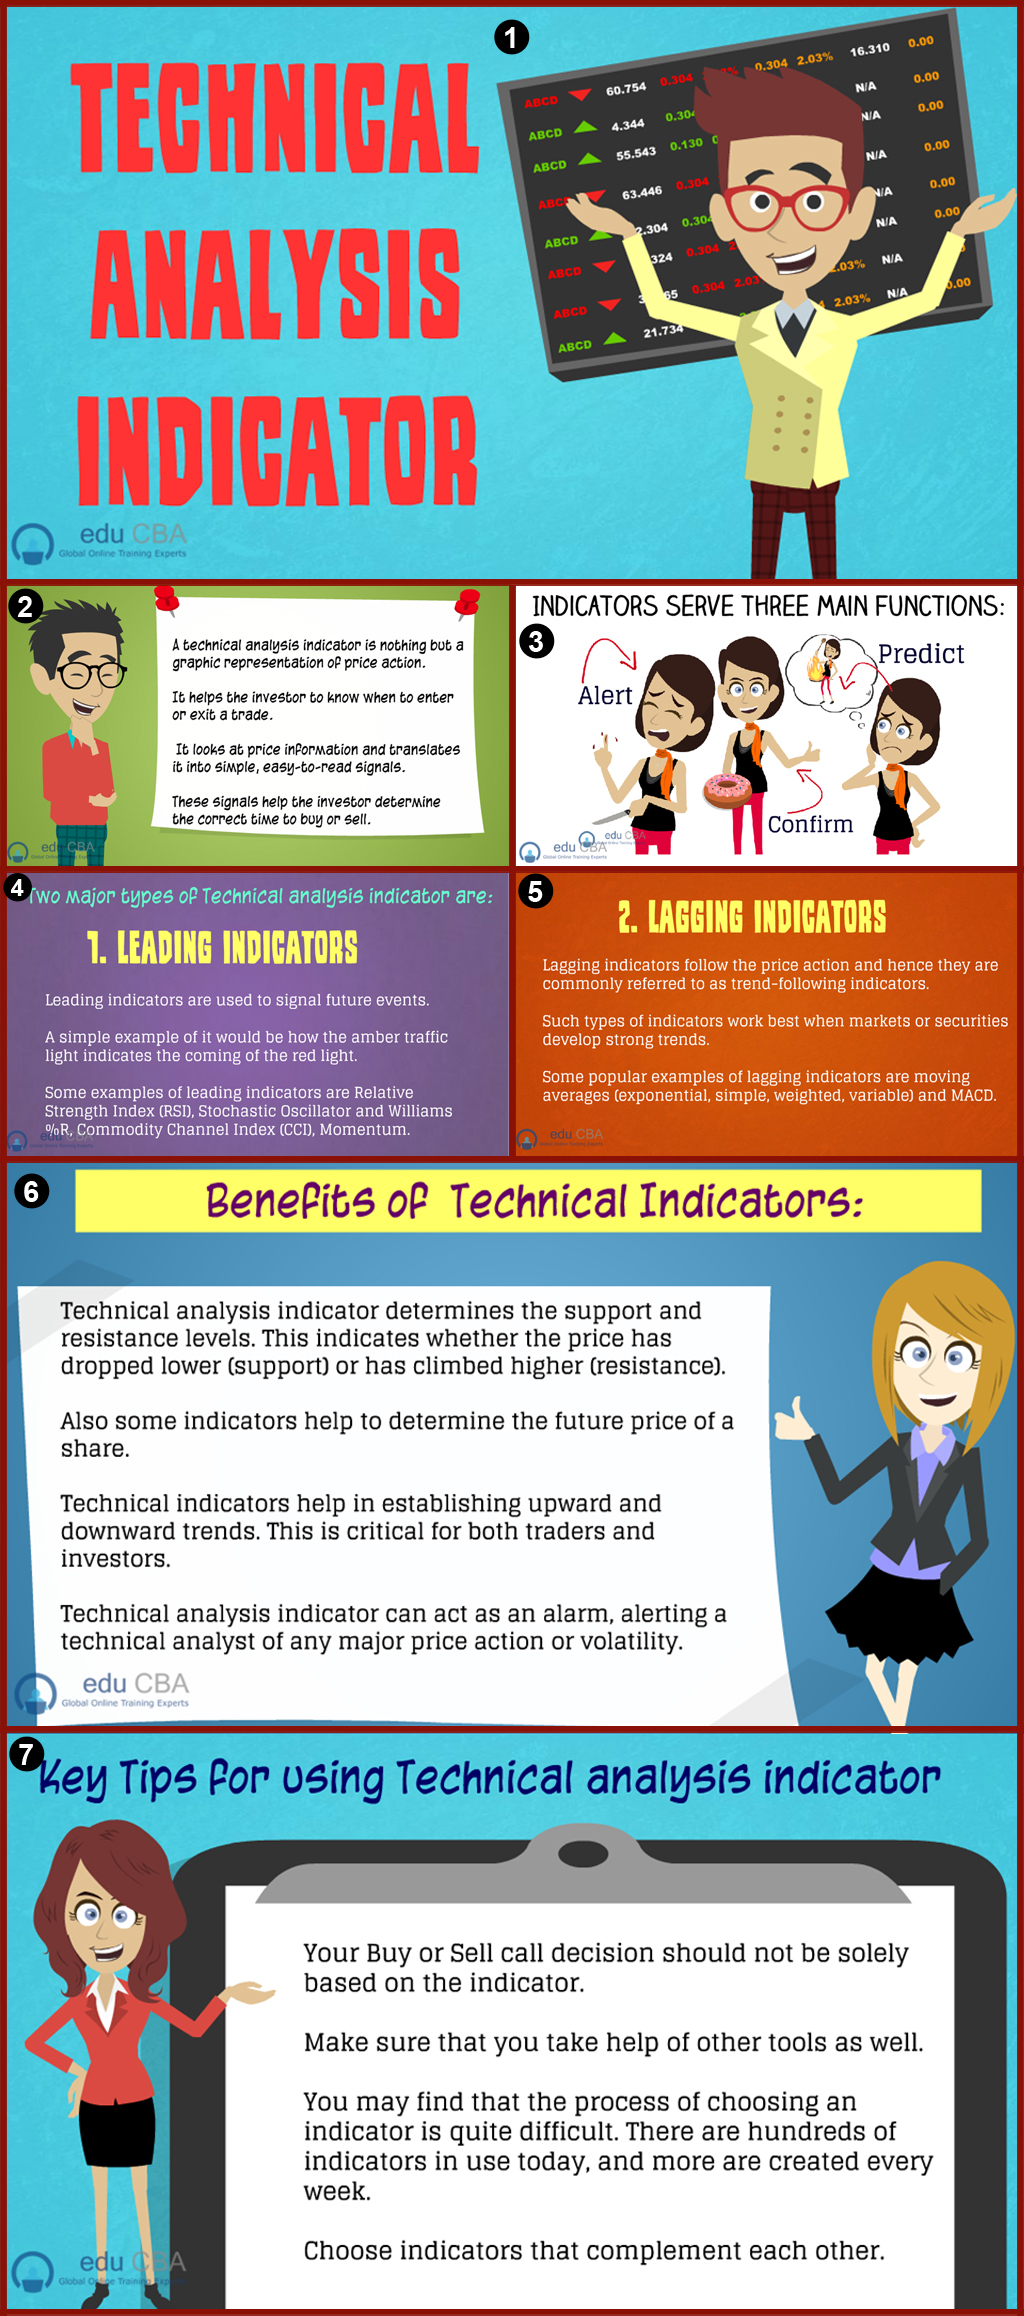
You must know that the Technical analysis indicator is the basis of technical analysis. They are useful for determining the future trends of stocks or economies. Technical analysis indicator helps the investor know when to enter or exit a trade to make a profit. Technical analysis indicator looks at price information and translates it into simple, easy-to-read signals. These signals help the investor determine the correct time to buy or sell.
Technical analysis indicator provides clues to the investor, thus helping them to interpret the market patterns and the future behavior of the price. Therefore, combinations of price, volume, and time-sensitive Technical analysis indicators help maximize profits.
A technical analysis indicator is nothing but a graphic representation of price action. It consists of a series of data points derived by applying a formula to the price data of a specific security. Now you must be wondering what price data here means? Price data here is nothing but any combination of the open, high, low, or close over some time. In some cases, the indicators include only the closing prices, while others incorporate volume and genuine interest into their formulas. Then, the price data is entered into the formula, and data points are produced.
Introduction
To clarify your doubts, let’s understand them with a simple example. Let’s understand how a data point is made or generated. For example, the average of 3 closing prices is one data point. i.e. (41+43+43) / 3 = 42.33, the data point here.
However, if you think closely, you will understand that a single data point will not make sense. It does not offer much information and does not indicate anything. A series of data points is necessary for proper analysis to create valid reference points over time. Thus, by creating a time series of data points, a proper comparison can be made between present and past levels of information. Regarding analysis, technical indicators are usually shown in a graphical form above or below a security’s price chart. Once a visual representation is created, an indicator can be compared with the corresponding price chart of the security.
Also, one point to remember is that the Technical analysis indicator is distinguished because it does not analyze any part of the fundamental business, like earnings, revenue, and profit margins. They are designed primarily for analyzing short-term price movements. Thus, if you are a long-term investor, the Technical analysis indicator may be of little value as they do not cover the fundamentals of what is happening in the Company of interest.
A technical indicator offers a different viewpoint to analyze the price action. Some indicators, such as moving averages, are derived from simple technical analysis indicator formulas and are quite easy to understand. Other indicators like the Stochastic have complex formulas requiring more study to understand them fully.
Why use the Technical Analysis Indicator?
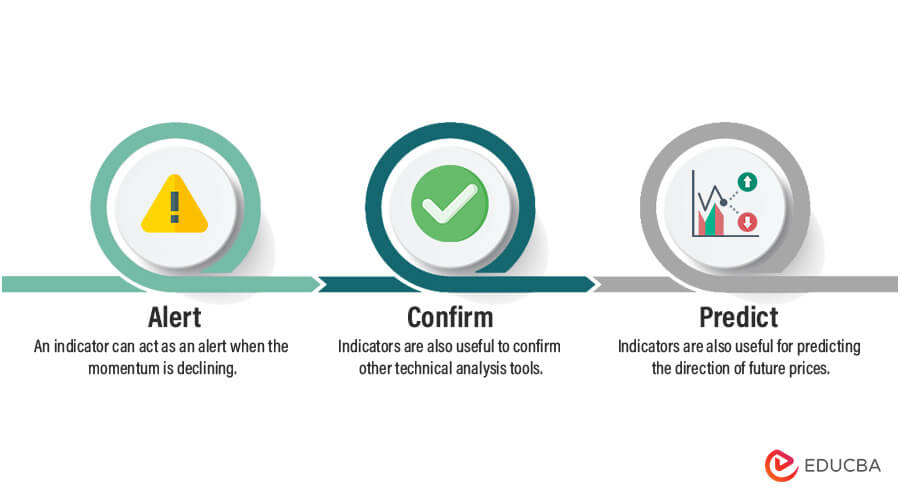
Indicators serve three main functions, as shown in the image above.
1. Alert
An indicator can act as an alert when the momentum is declining. It may be a signal to watch for a break of support. On the other hand, a large positive deviation building may serve as an alert to care for a resistance breakout.
2. Confirm
Indicators are also useful to confirm other technical analysis tools. They can be useful to confirm the breakout or the weakness.
3. Predict
Indicators are also useful for predicting the direction of future prices.
How is a Technical Analysis Indicator Derived?
Technical analysis indicator is derived from technical charts. These technical charts are graphical or pictorial representations of the market activity regarding upward or downward movements in stock prices over time.
If you consider a technical chart a plot, it will be easy to understand. In such a case, the price data set is on the Y-axis, and a function of time is on the X-axis. This price data includes the opening price, closing price, the day’s high or low price, average price, or a combination of these. The plotted data points on the chart are then shown as individual points or small bars.
When all these data points are joined, a wave-like pattern is obtained. From this, we can predict the future market price of a stock or its market trend. Hence, we want this for technical analysis to arrive at technical indicators.
Two Major Types of Technical Analysis Indicators
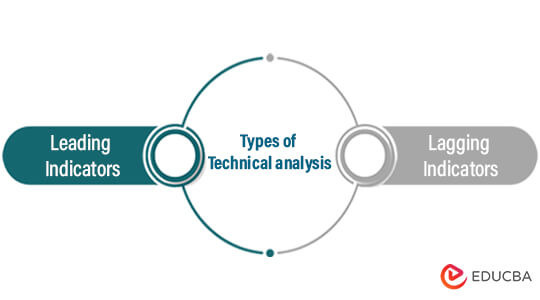
1. Leading Indicators
Leading indicators are useful to signal future events. A simple example would be how the amber traffic light indicates the coming of the red light. Leading indicators are useful for predicting price moments. Some leading indicators are the Relative Strength Index (RSI), Stochastic Oscillator and Williams %R, Commodity Channel Index (CCI), and Momentum.
Momentum Oscillators- Leading indicators generally come in the form of momentum oscillators. Momentum measures the rate of change in a security’s price. As the price of a security rises, price momentum increases. The faster the security rises, the more significant the increase in momentum. Once there is a slowdown in the bank, the rate also slows down.
Example- RSI
The relative strength index (RSI) is one of the most popular technical indicators. It is based on the speed and direction of the stock’s price movement. The RSI scale ranges from 0 to 100. When the RSI approaches 70, the asset or the security is overbought and, hence, overvalued. Therefore, getting out of that security at such a time is better.
On the other hand, when the RSI approaches 30, it indicates that the security may be getting oversold and, therefore, likely to become undervalued. ( Click on the image beside to understand it better).
RSI Buy Signal:
Buy when the RSI crosses above the oversold line, i.e., 30.
RSI Sell Signal:
Sell when the RSI crosses below the overbought line, i.e., 70
Benefits and Drawbacks of Leading Indicators
- It helps in early signaling for entry and exit.
- These indicators also generate more signals and allow more opportunities to trade.
- Early signs can act as an alert against a potential strength or weakness.
- Since the leading indicators generate more calls, the Technical analysis indicator is highly useful in trading markets.
- More signals and earlier signals mean that there can be chances of false alerts.
- False signals will increase the potential for losses.
2. Lagging Indicators
A lagging indicator gives a signal after the trend has started. It informs you, “Hey buddy, pay attention; the trend has started,d and you’re missing on it.” If we consider our example of the traffic light, the amber light is a lagging indicator telling that the green light has occurred before. In Financial terms, the lagging hands can be Profits or losses made by a company. However, the main challenge with the lagging indicators is that they do not measure the current activity.
Lagging indicators follow the price action and are commonly referred to as trend-following indicators. Such technical analysis indicators work best when markets or securities develop strong trends. Some popular examples of lagging indicators are moving averages (exponential, simple, weighted, variable) and MACD.
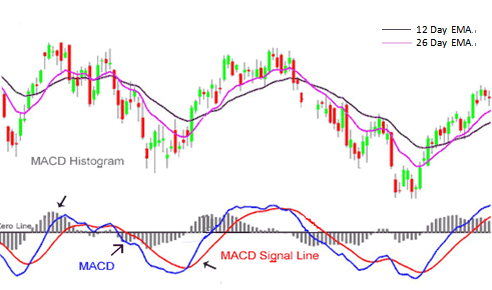
Example- MACD
![]()
![]()
MACD is short for moving average convergence/divergence. It is a trading indicator created by Gerald Appel in the late 1970s. It also reveals changes in the strength, direction, momentum, and duration of a trend in a stock’s price.
The MACD indicator is a collection of three-time series from historical closing price data. These three series are:
- The MACD series is proper. It is the difference between a “fast” (short period) exponential moving average (EMA) and a “slow” (more extended period) EMA of the price series.
- The “signal” or “average” series. This is an EMA of the MACD series itself.
- The “divergence” series. It is the difference between the above two series.
Remember the below calculations:
- MACD: (12-day EMA – 26-day EMA)
- Signal Line: 9-day EMA of MACD
- MACD Histogram: MACD – Signal Line
Benefits and Drawbacks of Lagging Indicators
- When the market or security develops a constant move, lagging indicators can be enormously profitable and easy to use.
- However, the main disadvantage is that the lagging indicators are not predictive.
- Another drawback of these indicators is that the signals tend to be late.
- What we want from an indicator are sensitivity and consistency. We wish that the hand should give early signals, and at the same time, there should be few false signals (termed as whipsaws). If we increase the sensitivity by reducing the number of periods, we will get an early signal, but at the same time, the number of false signals will also increase.
- If we decrease the sensitivity by increasing the number of periods, then the number of false signals will decrease, but at the same time, the signals will also lag.
- The longer the moving average, the slower the reactions and the fewer the signals.
- But if the moving average is short, it becomes faster and increases the number of false signals.
The Challenge of Indicators
- What we want from an indicator are sensitivity and consistency. We want the indicator to give early signals, and at the same time, there should be few false signals (termed as whipsaws). If we increase the sensitivity by reducing the number of periods, we will get an early signal, but at the same time, the number of false signals will also increase.
- If we decrease the sensitivity by increasing the number of periods, then the number of false signals will decrease, but at the same time, the signals will also lag.
- The longer the moving average, the slower the reactions and fewer the signals.
- But if the moving average is short, it becomes faster and increases the number of false signals.
List of Technical analysis indicators
Volume Indicators
Volume indicators help in confirming the strength of the trend.
Momentum Indicators
Momentum indicators help in determining the speed at which price is changing.
Common Oscillators
Oscillators are from prices and tend to oscillate within a fixed or a limited range.
Trend Indicators
Trend indicators help in determining future direction and trends.
Volatility Indicators
Volatility indicators help in judging the strength of the trend and breakouts.
The Benefits of a Technical Indicator
- Technical analysis indicator provides a viewpoint on the stock’s price action’s strength and direction. As discussed earlier, their primary function is to alert, confirm, and predict.
- Stock prices fluctuate continuously; making a track can become cumbersome. But here is when the Technical analysis indicator comes in handy. These Technical analysis indicators smooth out the data and make it easier to understand. They help in plotting the movements of the stock on a chart.
- Technical analysis indicator determines the support and resistance levels. This indicates whether the price has dropped lower (support) or has climbed higher (resistance).
- Also, some indicators help to determine the future price of a share.
- Technical indicators help in establishing upward and downward trends. This is critical for both traders and investors.
- Technical analysis indicators can act as an alarm, alerting a technical analyst of any major price action or volatility.
Key Tips for Using Technical Analysis Indicators
- Sometimes, traders forget that indicators are derivatives and not the direct reflection of the price actions. Sometimes, they tend to ignore the price action of a security and focus solely on an indicator.
- Hence, any analysis of an indicator should be with the price action in mind.
- The same indicator may sometimes show different behavioral and technical analysis indicator patterns when applied to other stocks.
- Your Buy or Sell call decision should not be solely based on the indicator. Make sure that you take the help of other tools as well.
- You may find that the process of choosing an indicator is quite tricky. Hundreds of indicators are in use today, and more are created weekly.
- Choose indicators that complement each other. Two or three indicators are usually sufficient to come to the right decision. You may avoid using the Technical analysis indicator that moves in unison and generates the same signals.
Conclusion
- Note that the best Technical analysis indicator is those that have been tried and tested in the past and proven successful.
- Do not become the “Jack of all Trades and Master of None!” Nothing will come your way if you attempt to master all Technical analysis indicators and oscillators.
- Use the indicators that best complement your trading style.
- Use two or three indicators, as using just one may give you a false signal.
- Remember that each technical indicator provides unique information. Identify it and grab the opportunity.
- Finally, be aware of the weakness associated with most Technical analysis indicators.
Always Remember
“Success is simple. Do what’s right, the right way, at the right time”.<
Technical Analysis Indicator Infographics
Learn the juice of this article in a minute through Technical Analysis Indicator Infographics.
First Image Source- binary-option-trading-guide.com
Recommended Articles
Here are some articles that will help you get more details about the Technical Analysis Indicator, so just go through the link.
