Updated July 25, 2023
Moving Average Formula (Table of Contents)
What is the Moving Average Formula?
The term “moving average” refers to the technical analysis technique that smoothens the fluctuation observed in the data in order to draw insights about any available trend or pattern in the data.
The data pattern is then used as an indicator for estimating the future. The moving average can be primarily of three types:
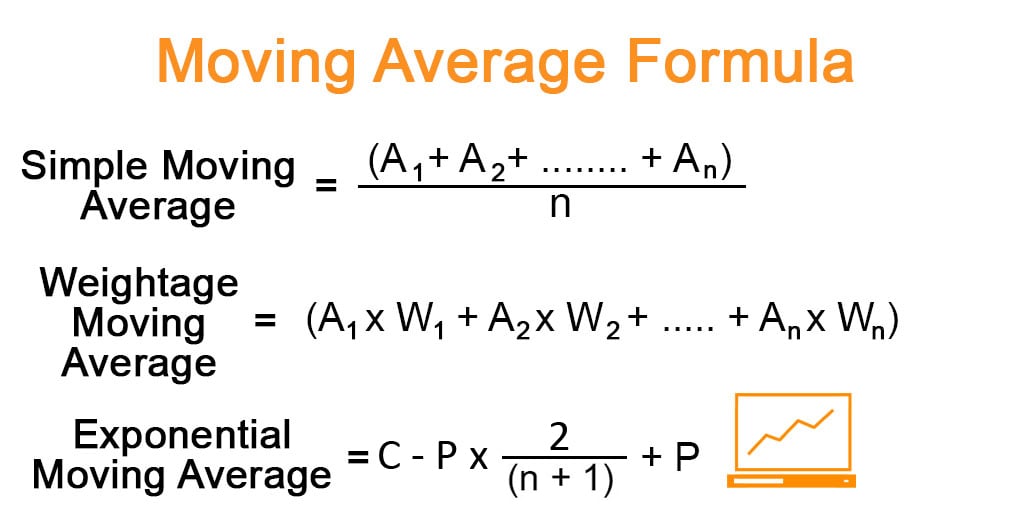
- Simple Moving Average
- Weighted Moving Average
- Exponential Moving Average
The formula for simple moving average at any point in time can be derived simply calculating the average of a certain number of periods upto that point in time. For instance, the 5-day simple moving average of stock price means the average of the stock price of the last five days. Mathematically, it is represented as,
where Ai is the data point in the ith period
The formula for the weighted moving average uses different weightage for data points from different periods. Typically, the weightage decreases with each data point from previous periods. Mathematically, it is represented as,
where Ai and Wi are the data point in the ith period and its weightage respectively
The formula for exponential moving average assigns higher weightage to the current data point by using a multiplying factor. Mathematically, it is represented as,
where C and P are current data point and an exponential moving average of the previous period (simple average used for the first period) respectively
Examples of Moving Average Formula (With Excel Template)
Let’s take an example to understand the calculation of Moving Average Formula in a better manner.
Moving Average Formula – Example #1
Let us take the example of the stock price of a company to explain the concept of moving average. The stock prices for the last 12 days are as follows:
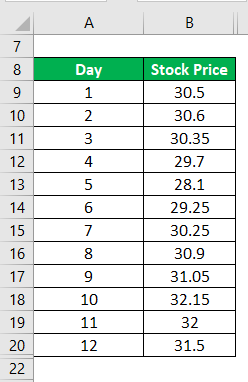
Predict the stock price on the 13th day using 4- day simple moving average.
Solution:
Moving Average is calculated using the formula given below
Simple Moving Average = (A1 + A2 + …… + An) / n
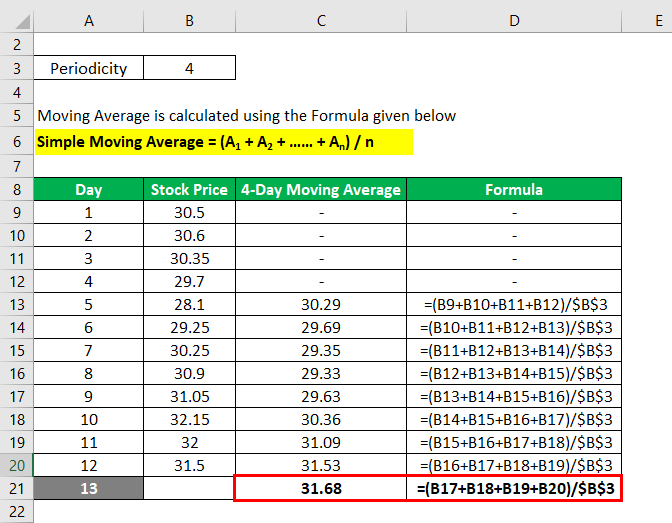
Based on a 4-day simple moving average the stock price is expected to be $31.68 on the 13th day.
Moving Average Formula – Example #2
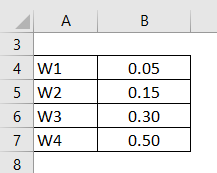
Let us take the above example to predict the stock price on the 13th day using 4- day weighted moving average such that most recent to last weightages are 0.50, 0.30, 0.15 and 0.05.
Solution:
Moving Average is calculated using the formula given below
Weightage Moving Average = (A1*W1 + A2*W2 + …… + An*Wn)
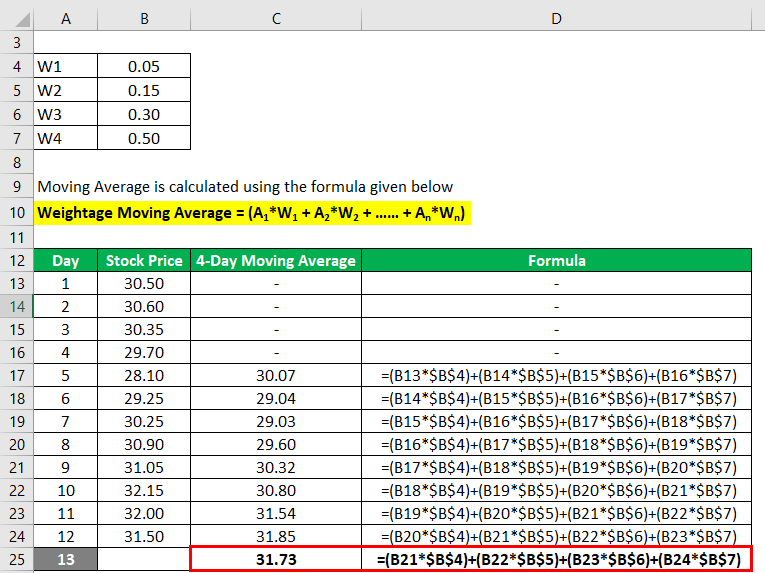
Based on a 4-day weighted moving average the stock price is expected to be $31.73 on the 13th day.
Moving Average Formula – Example #3
Let us take the above example to predict the stock price on the 13th day using a 4-day exponential moving average.
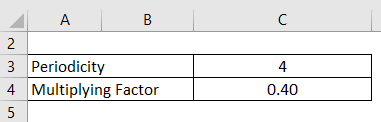
Multiplying Factor = 2 / (4 + 1) = 0.4
Solution:
Moving Average is calculated using the formula given below
Exponential Moving Average = (C – P) * 2 / (n + 1) + P
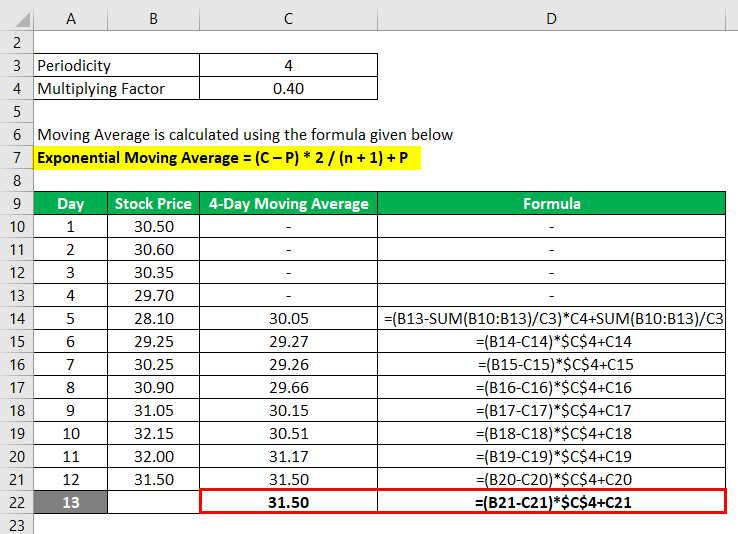
Based on a 4-day exponential moving average the stock price is expected to be $31.50 on the 13th day.
Explanation
The formula for simple moving average can be derived by using the following steps:
Step 1: Firstly, decide on the number of the period for the moving average, such as 2-day moving average, 5-day moving average, etc.
Step 2: Next, simply add the selected number of consecutive data points and divide by the number of periods. Repeat the exercise to arrive at a set of averages.
Simple Moving Average = (A1 + A2 + …… + An) / n
The formula for the weighted moving average can be derived by using the following steps:
Step 1: Firstly, decide on the weightage to be assigned to the data point of each period.
Step 2: Next, add the products of the data points and their respective weightage. Repeat the exercise to arrive at a set of averages.
Weightage Moving Average = (A1*W1 + A2*W2 + …… + An*Wn)
The formula for exponential moving average can be derived by using the following steps:
Step 1: Firstly, decide on the number of the period for the moving average. Then calculate the multiplying factor based on the number of periods i.e. 2 / (n + 1).
Step 2: Next, deduct the exponential moving average of the previous period from the current data point and then multiplied by the factor. Then add back the exponential moving average of the previous period. Repeat the exercise to arrive at a set of averages.
Exponential Moving Average = (C – P) * 2 / (n + 1) + P
Relevance and Use of Moving Average Formula
It is crucial to understand the concept of moving averages as it provides important trading signals. An increasing moving average indicates that the security is exhibiting uptrend and vice versa. Further, a bullish crossover indicates an upward momentum that occurs when a short-term moving average crosses above a long-term moving average. On the other hand, a bearish crossover indicates a downward momentum that occurs when a short-term moving average crosses below a long-term moving average. All these indicators are used in predicting the movement of securities in the future.
Recommended Articles
This is a guide to Moving Average Formula. Here we discuss how to calculate Moving Average Formula along with practical examples. We also provide a downloadable excel template. You may also look at the following articles to learn more –
