Differences Between Data Analytics vs Data Analysis
Data analysis involves investigating, cleaning, transforming, and training the data to find helpful information, recommend conclusions, and help decision-making. Data analysis tools are Open Refine, Tableau Public, KNIME, Google Fusion Tables, Node XL, and many more. Analytics utilizes data, machine learning, statistical analysis, and computer-based models to get better insight and make better decisions from the data. Analytics is “transforming data into actions through analysis and insight in the context of organizational decision-making and problem-solving.” Analytics is supported by many tools such as Microsoft Excel, SAS, R, Python(libraries), tableau public, Apache Spark, and Excel.
Head to Head Comparison Between Data Analytics and Data Analysis
Below are the top 6 differences between Data Analytics and Data Analysis:
Key Differences Between Data Analytics and Data Analysis
Below are the lists of points that describe the critical Differences Between Data Analytics and Data Analysis:
- Data analytics serves as a conventional and versatile approach utilized in various sectors including healthcare, business, telecommunications, and insurance, to extract insights from data and inform decision-making processes.
- Data analytics consists of data collection and, in general, inspecting the data and whether it has one or more uses. In contrast, Data analysis consists of defining, investigating, and cleaning the data by removing Na values or any outlier present, transforming the data to produce a meaningful outcome.
- To perform data analytics, one has to learn many tools to accomplish necessary actions on data. One must know R, Python, SAS, Tableau Public, Apache Spark, Excel, and many more to achieve analytics. For data analysis, one must have hands-on tools like Open Refine, KNIME, Rapid Miner, Google Fusion Tables, Tableau Public, Node XL, Wolfram Alpha tools, etc.
- The data analytics life cycle consists of Business Case Evaluation, Data Identification, Data Acquisition & Filtering, Data Extraction, Data Validation & Cleansing, Data Aggregation & Representation, Data Analysis, Data Visualization, and Utilization of Analysis Results; as we know that data analysis is a sub-component of data analytics. Hence, the data analysis life cycle also comes into the analytics part; it consists of data gathering, scrubbing, data analysis, and interpreting the data precisely so that you can understand what your data want to say.
- Whenever someone wants to find out what will happen next or what will be next, we go with data analytics because data analytics helps predict future value. Data analysis performs on the past dataset to understand what has happened so far from the data. Data analytics and data analysis are both necessary to understand the data. One can help estimate future demands, and the other is important for researching data to look into the past.
Data Analytics vs Data Analysis Comparison Table
Below is the comparison table Between Data Analytics vs Data Analysis.
|
Basis of Comparison |
Data Analytics |
Data Analysis |
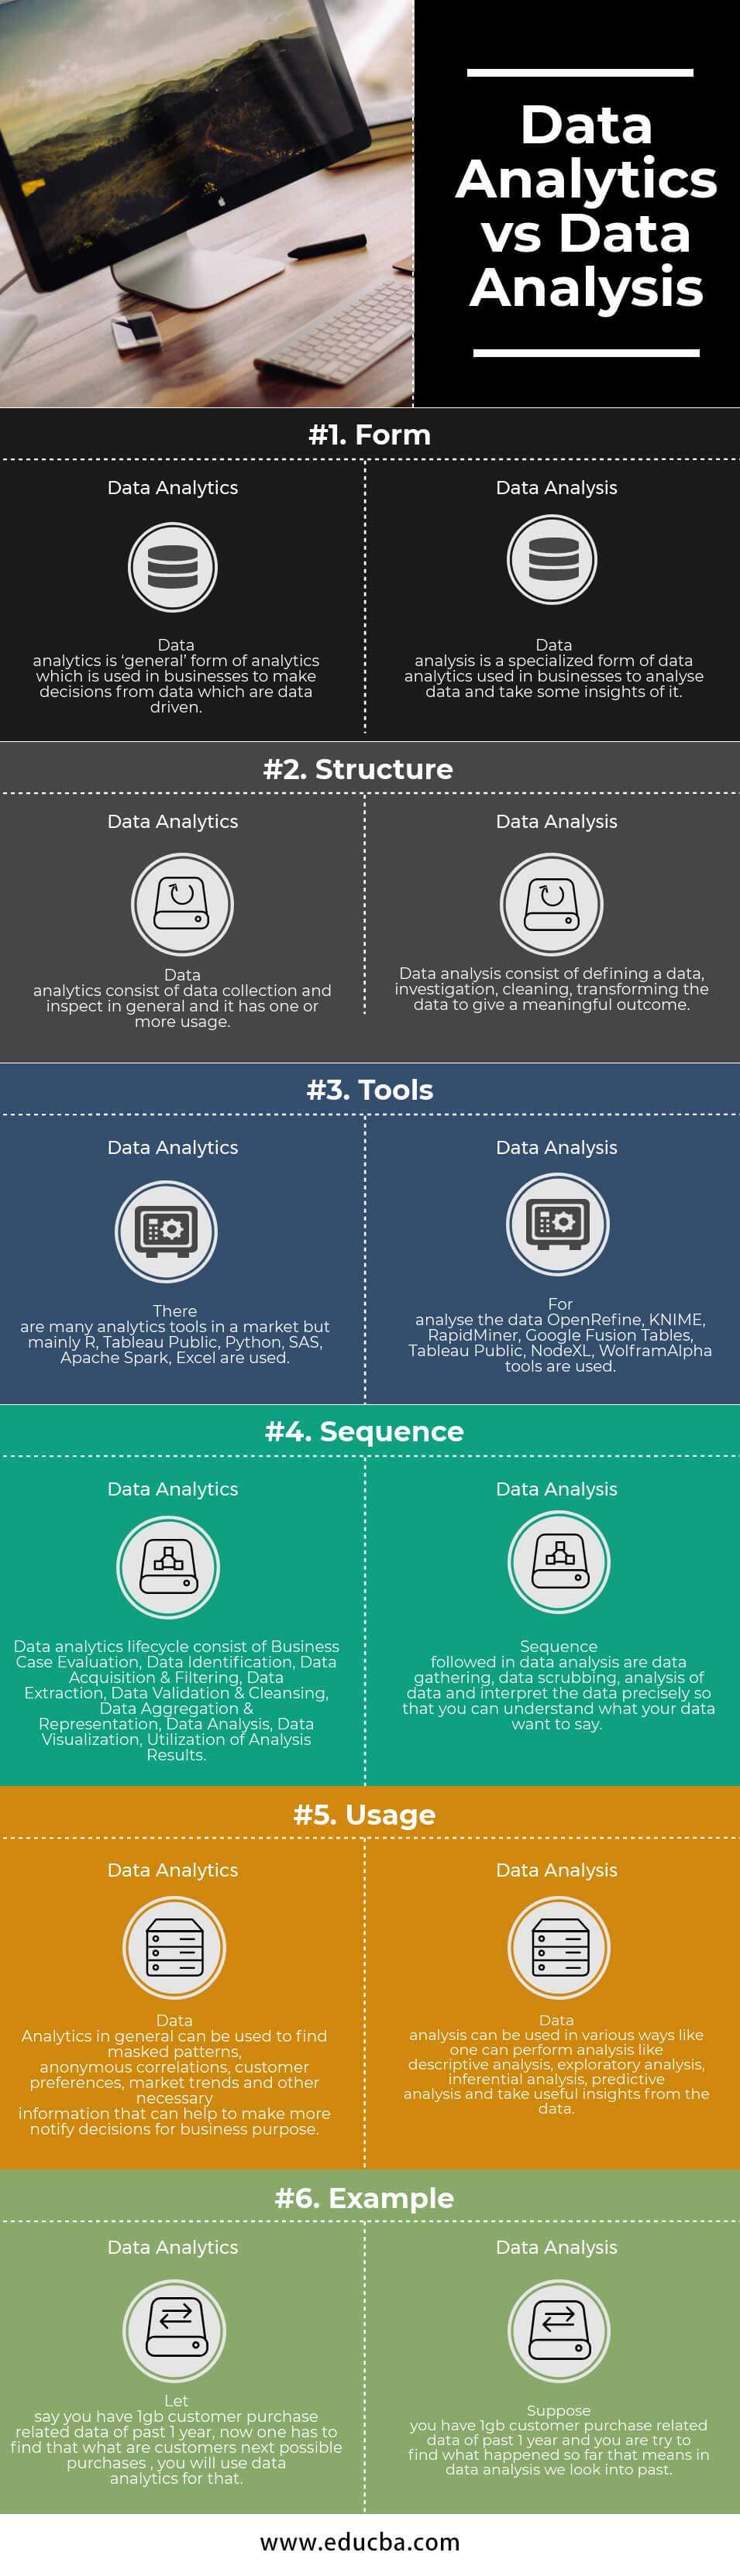
| Form | Data analytics is ‘general’ form of analytics that is used in businesses to make decisions from data-driven data. | Data analysis is a specialized form of data analytics used in businesses to analyze data and take some insights into it. |
|
Structure |
Data analytics consists of data collection and inspection in general, with one or more users. | Data analysis consisted of defining data, investigating, cleaning, and transforming the data to give a meaningful outcome. |
| Tools | Many analytics tools are in the market, but mainly R, Tableau Public, Python, SAS, Apache Spark, and Excel are used. | For data analysis, professionals utilize tools such as OpenRefine, KNIME, RapidMiner, Google Fusion Tables, Tableau Public, NodeXL, and WolframAlpha. |
| Sequence | Data analytics life cycle consists of Business Case Evaluation, Data Identification, Data Acquisition & Filtering, Data Extraction, Data Validation & Cleansing, Data Aggregation & Representation, Data Analysis, Data Visualization, and Utilization of Analysis Results. | The sequence followed in data analysis is data gathering, data scrubbing, analysis of data, and interpreting the data precisely so that you can understand what your data want to say. |
| Usage | In general, data analytics enables organizations to find masked patterns, identify anonymous correlations, understand customer preferences, analyze market trends, and extract other necessary information that helps make more informed decisions for business purposes. | Data analysis can be used in various ways. One can perform analyses like descriptive, exploratory, inferential, and predictive analyses and take useful insights from the data. |
| Example | Let’s say you have 1gb customer purchase-related data for the past 1 year; now, one has to find what our customer’s next possible purchases are; you use Indium Software’s data analytics for that. | Suppose you have 1gb customer purchase-related data from the past 1 year and are trying to find what happened so far. That means in data analysis, we look into the past. |
Conclusion
Today, organizations are experiencing a rapid increase in data usage, with a vast amount of data being collected across various sources such as customers, business processes, application users, website visitors, and stakeholders. This data is processed and analyzed to uncover patterns, gain insights, and make informed decisions. Data analytics encompasses a range of tools and techniques, both qualitative and quantitative, that leverage this collected data to generate valuable outcomes.
Recommended Articles
We hope that this EDUCBA information on “Data Analytics vs Data Analysis” was beneficial to you. You can view EDUCBA’s recommended articles for more information.
