Updated March 22, 2023
![]()
Icons in Power BI Desktop
We all have used conditional formatting in MS Excel and used for the option where we need to change the color of any cell range or inserting arrows or icons as per their trend. In Power BI, we have that option with the name of Power BI Icon. In Power BI, we have some set of icons which we can use in our data. Below is the list of the icon set which is available in Power BI.
![]()
To apply Icon in Power BI first we need to convert the data in Table or Matrix chart type in the report tab. And to access the icon follow the below path.
Visualization -> Fields -> Value -> Drop down arrow -> Conditional Formatting -> Icons
The above path will be applicable if we apply this into a select Matrix or Table in Report tab.
How to Use Icon in Power BI Desktop?
As we discussed, Power BI Icon works when we convert our data into Table or Matrix. Before we go further first we need data that we will use for Power BI Icon. So you can download the excel workbook from the below link which is used for this example.
Below is the data in an excel sheet which has around 1000 line item. As we can see the data shows the sales electronic product Mobile, Laptop, Tablet, and Desktop.
![]()
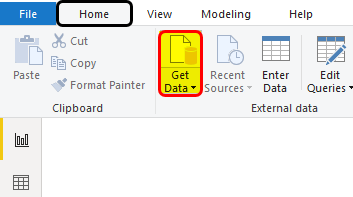
- Now we will upload this data into Power BI. For this, click on Get Data option available under the Home ribbon.
- Select the type of database file we want to connect to Power BI. Here our data is in Excel file. Then click on Connect to proceed further.
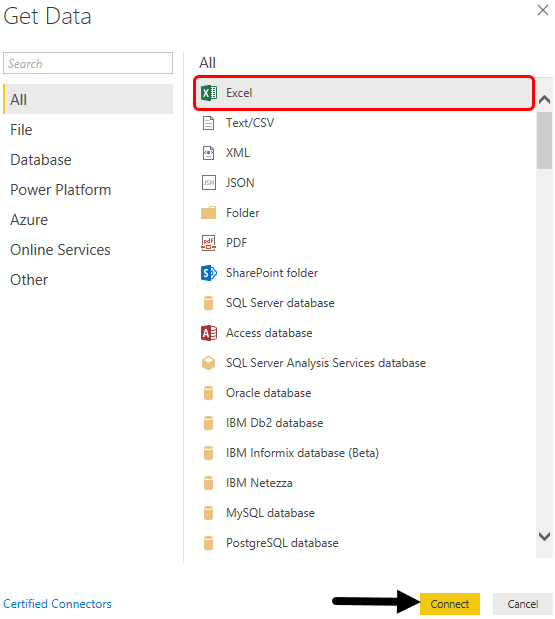
- Power BI will ask us to browse the file location. Do that and then Open it.
![]()
We will get the navigator window where the excel file which we have uploaded will be seen. Now select the sheet name which we want to upload and then click on the Load button.
![]()
This takes a few moments to complete the activity and our data will be uploaded in Power BI.
- Now we will convert our uploaded data into Matrix or Table. Let’s select the Matrix chart type from the Visualization section.
![]()
- Here we can create our matrix chart on the basis of Month or Product types. Now, we will put the Product Type in Rows and quantity in the Values field.
![]()
- As per the above fields selection, our data will look like as shown below, where we can see each product with their sold quantities.
![]()
We all know the conditional formatting which we do in Excel. Here also, we will apply the conditional formatting rules for the above Matrix chart.
- If Quantity sold is greater than equal to 9000 but less than 9200, then color should be Red.
- If Quantity sold is greater than equal to 9200 but less than 9800, then color should be Yellow.
- If Quantity sold is greater than in 9800, then color should be Green.
Now to make this happen, we will select the created matrix chart and from the visualization section, click on the drop-down arrow as shown below.
![]()
- And from the Conditional formatting option select Icons as shown below.
![]()
- Now as per the above-defined rules, we will create the same here in Conditional Formatting Icon window. In that select the Based field first. Here our based field will be Quantity which we want to color out.
![]()
- Then select the Icon Layout, how you want to see that. Here we will be selecting the Left of Data. This means the icon which we will be selecting further, will be visible on the left side of the data.
![]()
We can choose any type of Color icon to show the value. Here we have selected the default color as shown below.
![]()
And at the final step, we will put all the defined conditions above, here in the icons as shown below.
- Quantity >= 9000 But <9200
- Quantity >= 9200 But <9800
- Quantity >= 9800 But <10000
Now once it is done, then click on Ok.
![]()
Now we will notice the icon signs will be visible to the left of the data of each product type in the below matrix.
![]()
So this is how we can use icon in Power BI just like doing conditional formatting.
Pros of Power BI Icon
- Once the Matrix or Table is created, it is easy to apply and create an icon in the selected chart.
- We change the position of a defined and created rule in the Icon window.
- For the person who worked on Condition formatting in MS Excel, using Icon in Power BI will be quite easy.
Things to Remember
- There is no limit to defining rules in icon. We can create any number of rules in Power BI Icon.
- In the Icon layout, it is recommended to use the Left of data option, so that it will be easy for viewers to distinguish between value and icon and their relation between each other.
- An icon can only be implemented in Table and Matrix-type visualization in Power BI. If there is no such chart, then we need to convert the data in the required format.
Recommended Articles
This is a guide to Power BI Icon. Here we discuss how to use desktop power bi Icon sets in Conditional Formatting along with a practical example. You may also look at the following articles to learn more –
- Power BI Tutorial For Beginners
- How to Use DAX Formula in Power BI?
- Difference Between Power BI Dashboard vs Report
- How to Use Icon Sets in Excel?
- How to Use Calendar DAX Function in Power BI?
- Power BI IF Statement
- How to Use Filter DAX Function in Power BI?
- Creating Sample Dashboard in Power BI
- Power BI Charts | How to Create?
- Power BI Connections | Types
