Difference Between Power BI Dashboard vs Report
Power BI dashboards are one placeholder to display the most important decision-making facts to run a business. But reports are more detailed data displayed in many formats like charts, graphs, lists in tabulars, etc. Dashboards are a business key performance indicator view that displays key values that can change business profits and can be glanced at on one screen. Reports are based on one dataset or one business unit data, for example, reports of a store belonging to California. Reports and dashboards are dependent on each other because of any operational value or from a metric value. The Power BI report allows users to drill down to the detail granularity at the report level.
Head to Head Comparison Between Power BI Dashboard vs Report(Infographics)
Below are the Top 8 Comparison Between Power BI Dashboard vs Report
Key Differences Between Power BI Dashboard vs Report
Below is the list of items, explain the Differences Between the Power BI dashboard reporting.
- The Power BI dashboard screen size page consists of key information collected and combined across different reports and their datasets and facts. In contrast, collecting reports involves displaying various data sets, and users can access different pages to view the data in the reports.
- Desktops cannot access Power BI dashboards, but users can create and view reports on a desktop.
- Power BI dashboards utilize various data sources, incorporating maps, graphs, and other elements. However, Power BI reports can only draw data from a single dataset.
- Power BI dashboard capabilities of pinning existing visualization are only from the current dashboard to other dashboards, normally called dashboard navigation. Still, Power BI reports can pin or navigate to any reports or dashboards.
- Users cannot subscribe to an email subscription or a Power BI dashboard, but they can subscribe to reports for delivery to their email inbox at any given point in time.
- Power BI dashboards have an alerting feature where attention condition arises, dashboards raise an alert, but in reports, we cannot have this feature.
- Power BI dashboards cannot slice and dice, but reports have many ways to filter and slice.
- Natural language queries are only available from the dashboard, but they’re not available for reports.
- Power BI visualization cannot be changed, but reports visualization can be changed and saved. Still, it depends on the user’s role and permissions in accessing dashboards and reports.
- Users can export data only in the Power BI dashboard, not the visualization. However, in reports, users can export data to various formats, such as Excel tabular formats.
- You can set Power BI dashboards as featured or favorites, but you cannot create featured Power BI reports.
- Reports are information providers to dashboards, and this information can be in many formats like text, Table, chart, number, etc.
- The dashboard appears on the screen display, but navigating through the report involves multiple pages. Reports contain detailed data information, such as store sales by location for the current year. Because of the substantial amount of data, the information requires numerous pages to accommodate it.
- Users can drill down Power BI reports to different levels of datasets upon which they build reports. They can export reports to any format and download them to a local desktop for further analysis. Additionally, users can publish and subscribe to reports on the web through email.
- Dashboards share the same features as reports but have limited export formats. Users utilize dashboards to visualize essential data rather than analyze data, a task reserved for reports.
Comparisons Table Power BI Dashboards vs Report
Below are the lists of points that describe the comparisons Between Power BI Dashboards and Report.
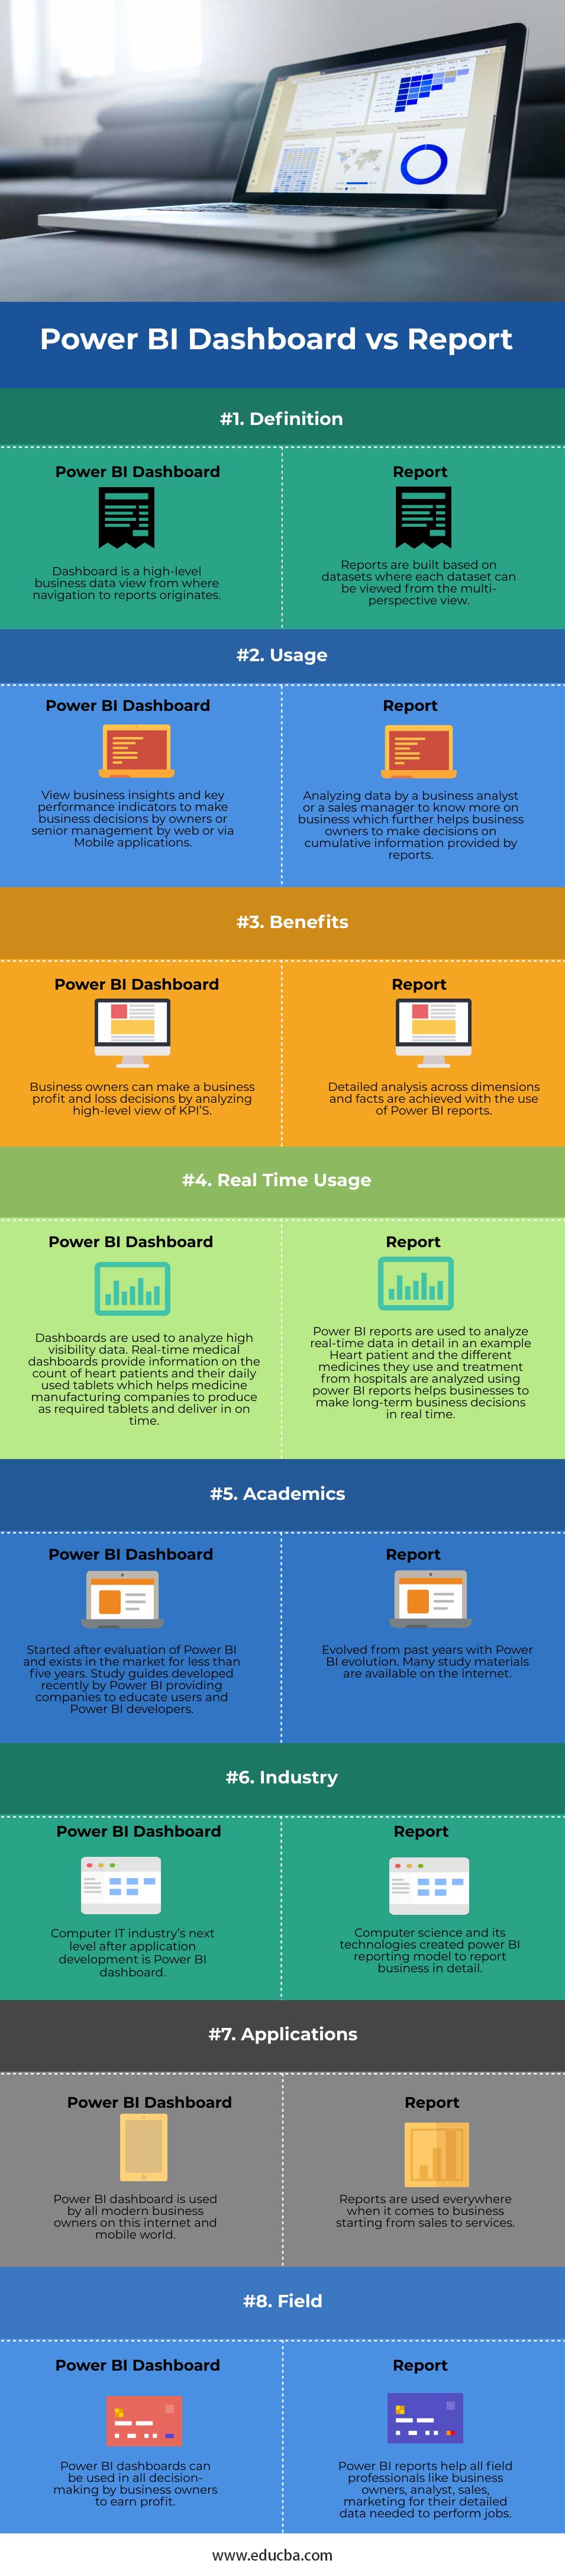
| Basis of Comparison | Dashboards | Reports |
| Definition | Dashboard is a high-level business data view from where navigation to reports originates. | Users build reports based on datasets, examining each dataset from a multi-perspective view. |
| Usage | View business insights and key performance indicators to make business decisions by owners or senior management via the web or via Mobile applications. | Analyzing data by a business analyst or a sales manager to know more about business further helps business owners make decisions based on cumulative information provided by reports. |
| Benefits | Business owners can make business profit and loss decisions by analyzing high-level views of KPIs. | Using Power BI reports enables us to achieve detailed analysis across dimensions and facts. |
| Real-Time Usage | Dashboards are used to analyze high-visibility data. Real-time medical dashboards provide information on the count of heart patients and their daily used tablets, which helps medicine manufacturing companies to produce as required tablets and deliver them on time. | Businesses use Power BI reports to analyze real-time data in detail, examining factors such as heart patients, the various medicines they use, and their treatment in hospitals. This analysis aids businesses in making informed, long-term decisions in real time. |
| Academics | It started after the evaluation of Power BI and has existed in the market for less than five years. Study guides developed recently by Power BI provide companies with a way to educate users and Power BI developers. | Evolved from past years with Power BI evolution. Many study materials are available on the internet. |
| Industry | The Power BI dashboard is the next level of the computer IT industry after application development. | Computer science and its technologies created a power BI reporting model to report business in detail. |
| Applications | All modern business owners use the Power BI dashboard on this internet and mobile world. | Businesses use reports for various functions, ranging from sales to services. |
| Field | Business owners can use Power BI dashboards in all decision-making processes to enhance profitability. | Business owners, analysts, sales, and marketing for their detailed data needed to perform jobs. |
Conclusion
Dashboards and reports are part of the Power BI online service, Here is a conclusion to one of the main questions people ask during the initial stages of building a Power BI solution. During onsite interviews, candidates often mistakenly communicate that Power BI dashboards and reports are the same.. However, understanding the differences is important to leverage knowledge of Power BI.
