Power BI Tutorial For Beginners (Table of Contents)
- Power BI Desktop Tutorial for Beginners
- Getting Started with Power BI Desktop Tutorial
- How to Import Data in Power BI?
Power BI Desktop Tutorial for Beginners
This Power BI Desktop Tutorial for beginners deals with all the essential things that a beginner needs to start learning in the visualization of data. Power BI, where BI stands for Business Intelligence, is a very powerful tool when it comes to using data visualization. There are many tools in the market for Data visualization such as Tableau, SAP BI but Power BI is the easiest to learn. We have been using MS Excel for ages to create different graphs and charts but that has limitations as well. In the new age, we have a great tool like Power BI which is also the product of Microsoft. It is very easy to install Power BI on any laptop and desktop which we will see in the following example.
The process of creating graphs or visuals in Power BI is the same as that of the process we used to perform in Excel. Power BI uses raw data as input. Where, once we upload the data in Power BI, we can also do sanity, modification and scrub the data. But we cannot change any value there in the Power BI Data window.
Also, like we have different ways to fetch data in excel, we have way more options to fetch the data in Power BI as compare to excel. And ease of fetching the data is quite good as compared to other BI tools. Apart from installing Power BI in desktop and laptop, we can try Power BI for Mobile as “SAAS” (Software-As-A-Service). Power BI is available in 32Bit and 64Bit versions which can be downloaded from Microsoft website.
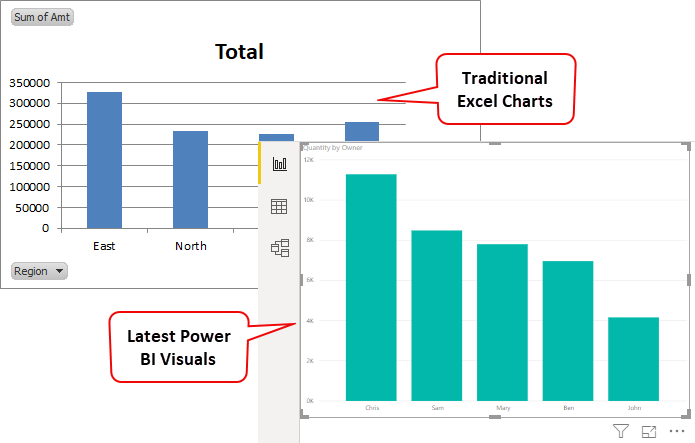
Just imagine, how far the technology has been updated. From older Excel charts to the latest Power BI cool charts.
As we have already mentioned that Power BI has different types of services under SAAS like Power BI Desktop, Service and Mobile application version. Profile under Power BI normally comes as a developer and analyst. But that work in Power BI comprises analysis, visualization, and charts, data connection and mapping.
Getting Started with Power BI Desktop Tutorial
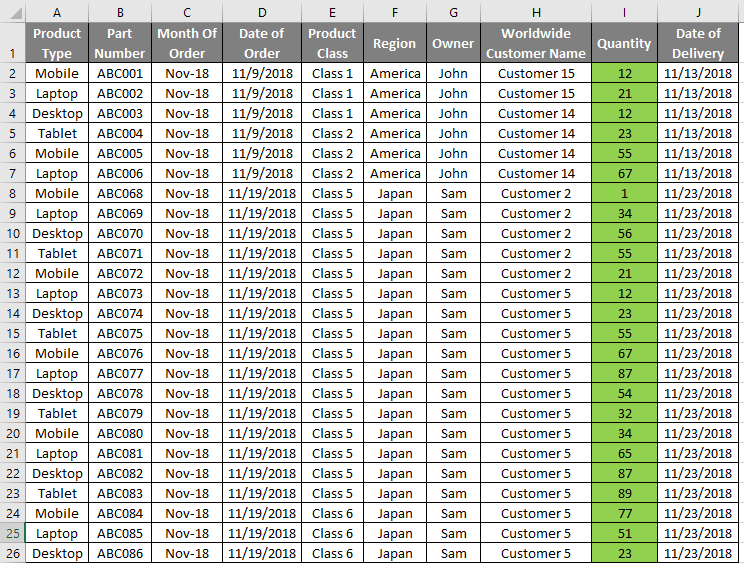
Here we have a sample Sales data of some electronic times such as Mobile, Tablet, and Desktop. And we can see there are some other headers as well such Region, Product Class, Dates, and Owner. This variety of data is quite helpful in getting the different types of visuals in Power BI. Below is the screenshot of it. As the data is of 1000 lines so it is not seen completely here.
Power BI is easy to install in any system we want to.
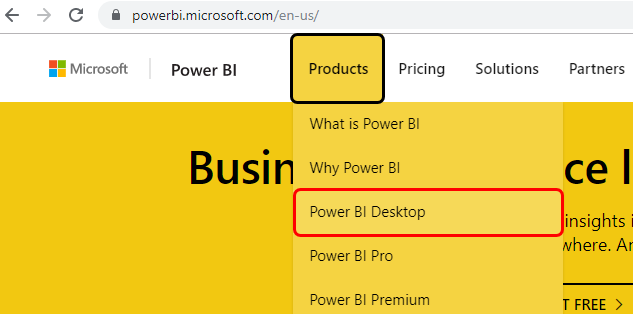
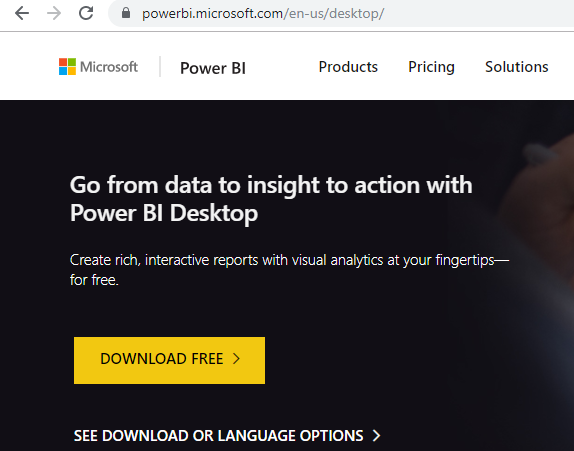
- First Install the Power BI first from the powerbi.microsoft.com website. This will take you to the direct page of Power BI.
- Go to this link and from Product tab select Power BI Desktop as shown below.
- Click on Download Free to install Power BI Desktop.
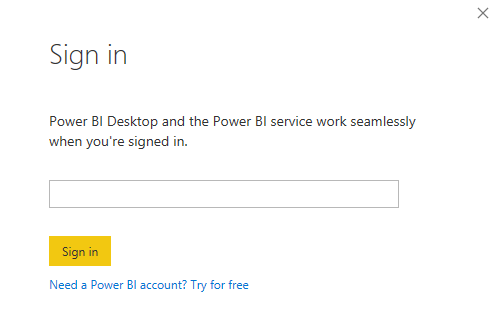
- Once downloaded and installed. Open Power BI. The very first page we will get where Power BI will ask us to sign in or skip. We sign in and use if it is for official purpose. If not then we can skip this step by clicking on the Close (X) button.
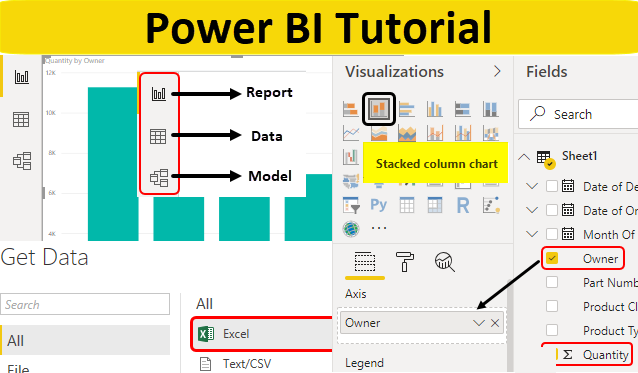
- This is our first window of Power BI. As we can see, there are 3 options highlighted which are Reports, Date, and Model.
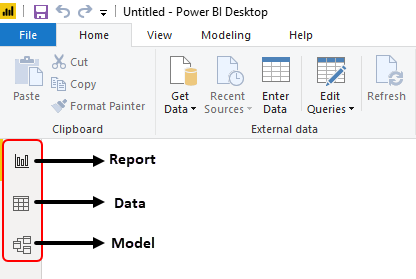
- Reports: This is the first field where we can create and see the charts and visuals. There many types of charts in Power BI. Most of them we have seen and used in MS Excel as well.
- Data: Here, we can see the uploaded or fetched data. Here also we can make changes in the data headers and data as well.
- Model: This is the place where we can create a model by linking 2 or more tables or data.
How to Import Data in Power BI?
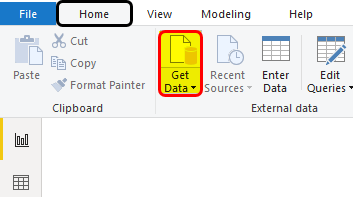
To import data in Power BI,
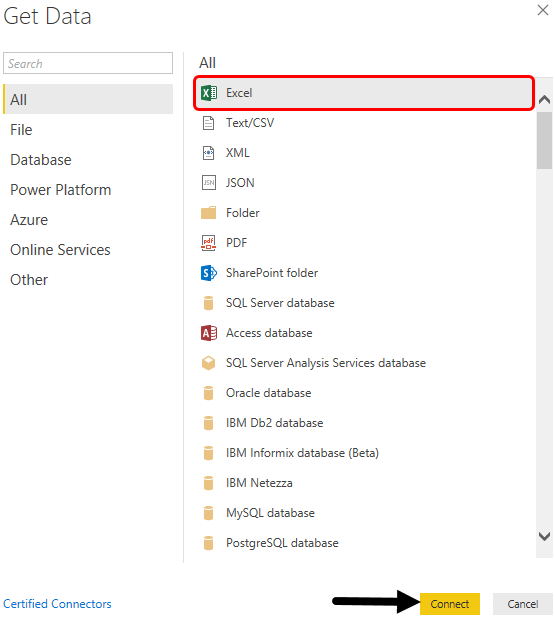
- Click on Get Data option which is there in the Home menu bar as shown below.
- We will get different ways and options to import the data in Power BI. Under ALL options, we will see different options such as Excel, Text/CSV, XML or different database options that we can link to get the visuals in Power BI. As we already have data in Excel, so we would choose Excel as shown below. And click on the Connect option after that.
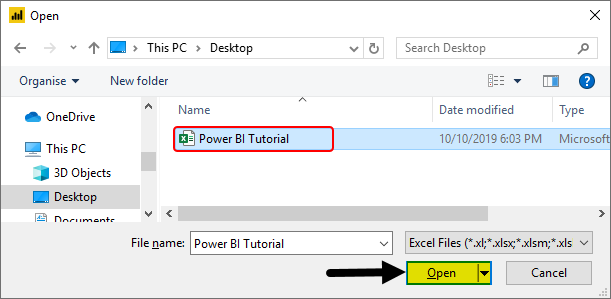
- Browse file location and open it.
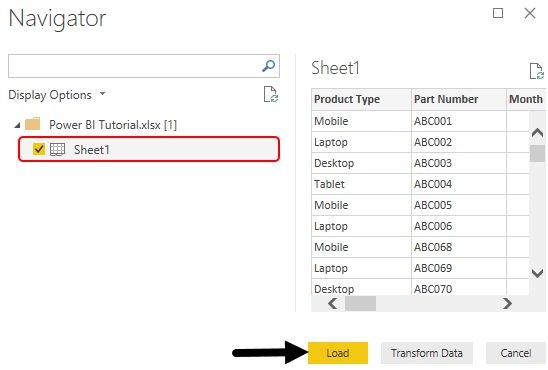
- Power BI will locate and connect the file. Select the sheet name which you want to open. Here our sheet is named as Sheet1. Check the box and click on the Load option.
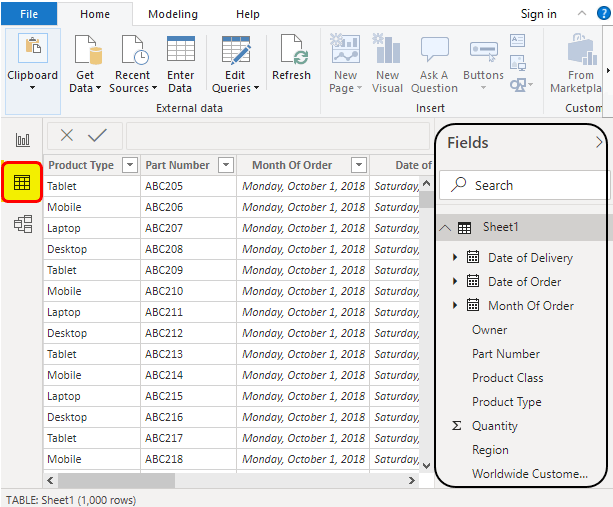
- Once data is uploaded, then click on the Data option which is on the right side. This will help us in seeing the complete data which we have uploaded just now. This sheet exactly works like a table in an excel sheet. We can see all the headers, filter tables which can be used as we do in Excel.
- Also, in Field Option, where we can see the recent changes made in data. If we modify the data, such as deleting any column or row, changing the position, it will be seen here.
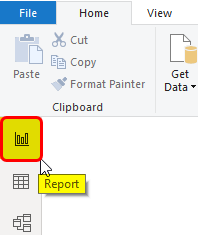
- Now to create the visual charts or graphs, go to Report option above Data option which we have seen above.
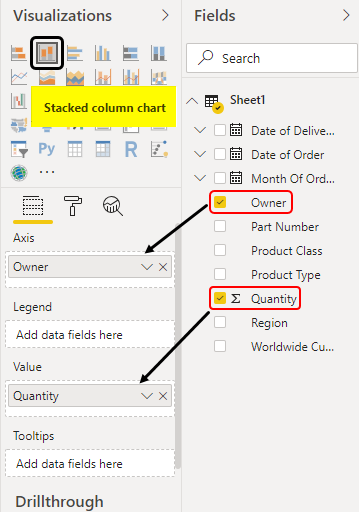
- On the right-hand side, we have different visualization and Field options. Now select any visualization that we want to see. Let’s say a stacked column chart is the one. Where we will see owner wise data as highlighted below. First, select the Stacked column option and choose the data which we want to map that with it.
- We will see our first chart which is the Stacked Column chart of Owner wise sales data as shown below.
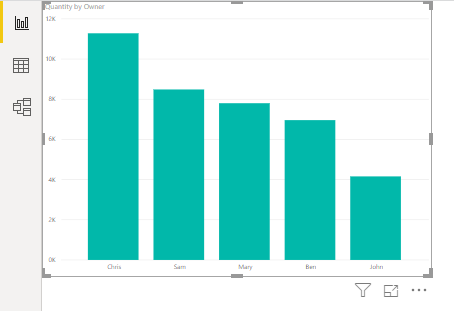
This is how a simple chart in Power BI can be created. We can create more than one chart in a single sheet as we do in Excel which we will learn in our next Power BI Desktop Tutorial.
Pros & Cons
The pros & cons are mentioned below.
- Unlike other BI tools, we use its full access without paying.
- We can use the Power BI Web tool as well if needed.
- The process of creating charts in Power BI is the same as that of MS Excel.
- Power BI cannot be used in iOS laptops and desktops.
Things to Remember About Power BI Desktop Tutorial
- We can create multiple charts and visualization with single data.
- We cannot change anything in data but we can change the views, sort the data and make the data easy to understand.
- On a single page, we can create more than 1 chart. And a number of charts on one page depends on how much space we use for it.
- Always remember to save the created plot or charts. And that can be saved as Power BI Extension .pbix.
Recommended Articles
This is a guide to Power BI Tutorial for Beginners. Here we learn the basic Power BI visualization tool techniques as well as how to import data to Power BI Desktop with pros and cons. You may also look at the following articles to learn more –
