Updated March 28, 2023
What are Power BI Slicers?
Slicers are the coolest way to connect different tables and charts and filter them just by clicking. Putting the filters in any table will only filter the table there in that table. But filters cannot be used to filter the data in any chart or graph. For that we have Slicers. Most of the people have already seen or used Slicers in Excel. But even if you did not then also this article will help you to understand the Slicer in Power BI a lot. With the help of Slicer, we can filter any connected table, chart or matrix just by only clicking.
How to Add Slicers in Power BI?
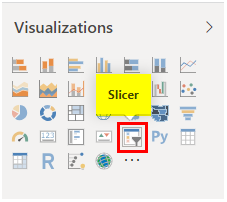
Slicers in Power BI is at the easiest place to access. We can access the Slicer from the visualization section by clicking on the icon. And this is available as shown below.
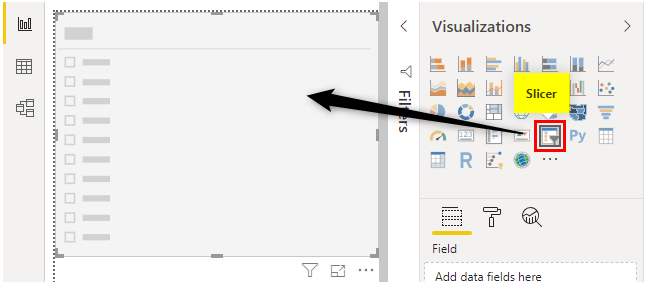
Once we click on it, we will be able to see the preview blank slicer as shown below.
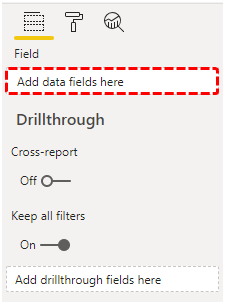
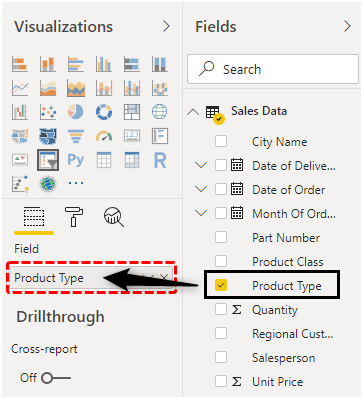
After selecting the Slicer from visualization, we will see, Slicer has only one field that to be added which is Field. We can use Drillthroguh as well if we want to filter further in the same direction. Now drag the fields which want to see in Slicer directly in the section which is highlighted below.
Let’s go through a step-by-step procedure and Add Slicers in Power BI. The steps in detail are as follows:
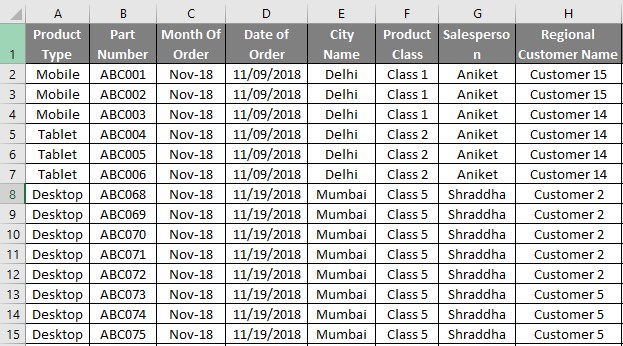
- If you want to see how slicer works, for that first create a Dashboard which consists of different types of charts and table in Power BI. Here we have sales data of electronics products such as Mobile, Laptops, Desktops and Tablets as shown below. Which we will use that to create a sample dashboard.
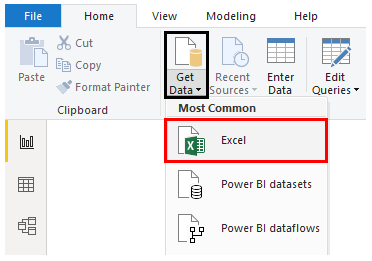
- Load the dataset into Power BI. For that click on Get Data Menu under Home Tab. From the drop-down menu of Get Data, select appropriate data source type. In this case, it is Excel, so clicked on Excel as shown in the below screenshot.
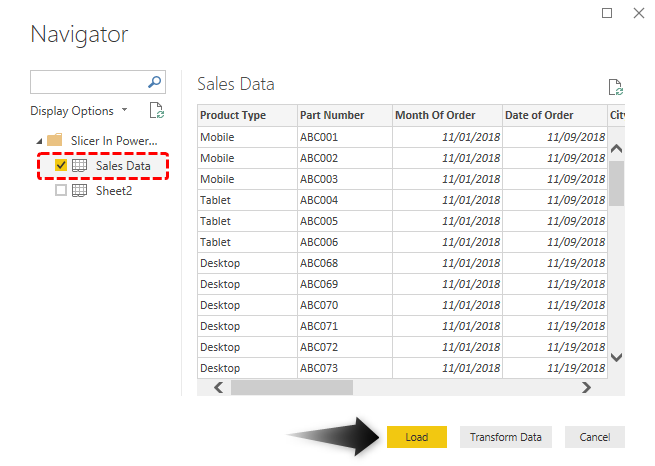
- From the drop-down menu of Get Data option, select the type of file source which we want to upload. Here, our data is in Excel format. Once we select the file, in the navigator window, it will ask us to select the sheet which we want to upload. It is because there might be more than 1 sheet with the data but the sheet we want to choose can be anything. After that, click on the Load button highlighted in yellow to load the data into Power BI.
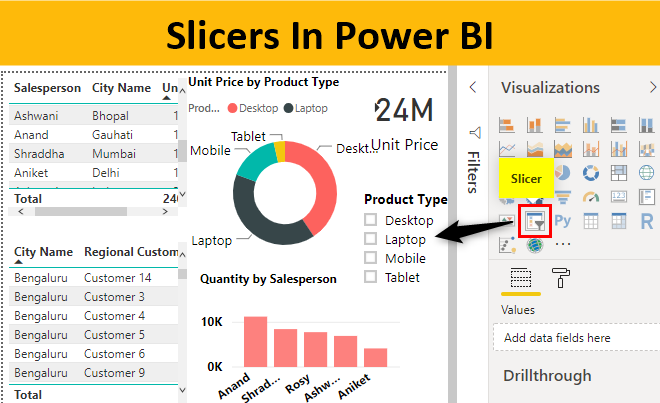
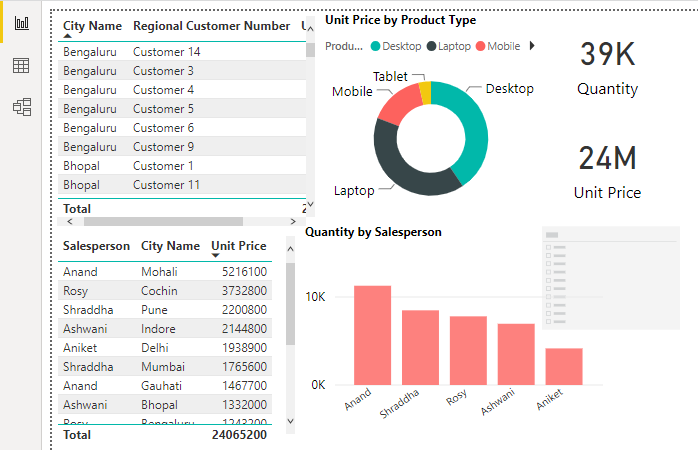
- With the help of the above data, we have created a simple dashboard which consists of Tables, Cards, Donut Charts and Stacked Column Charts as shown below. Also, we have kept some space to slicers as well.
- Now we will add a slicer into it. For this, follow the procedure as we learned above. Go to visualization and click on the Slicer icon as shown below.
- Now there are some certain fields by filtering them we will see the complete summary of the data. Here, major fields are City Name, Product Type and Salesperson. If we add any of them into the slicer, we will be able to slice our data with any of the parameters that it has. Let’ add Product type first here in slicer fields.
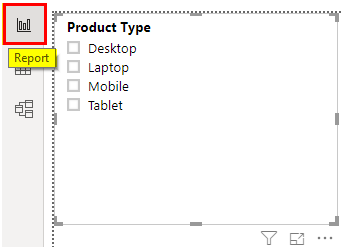
- This is how our first slicer will look like with the Product type data field.
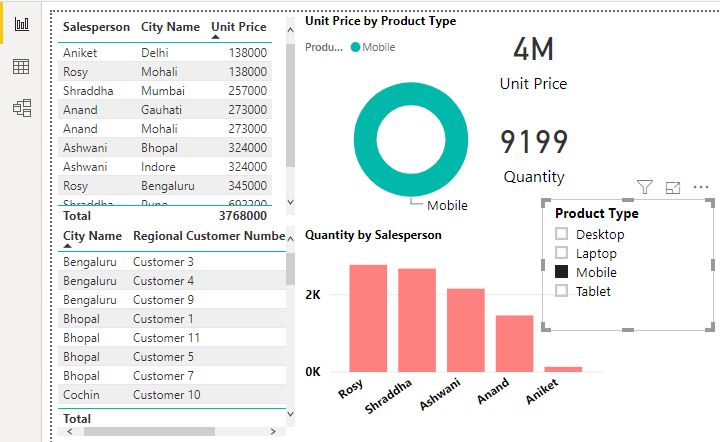
- To test this, we will select any of the product type. Let’ select Mobile. We will see, the complete dashboard got filtered with the data with respect to product type Mobile. We can see the total quantity, total price sale, the salespersons who sold Mobile with their quantities and city names as well.
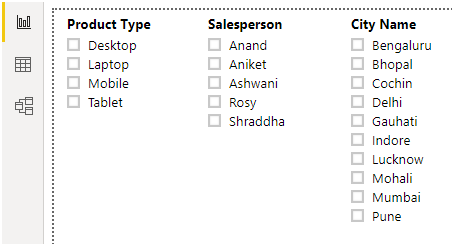
- Let’s insert few more slicers in our dashboard. For this, follow the same procedure. Here we will create the slicers for Salesperson and City name.
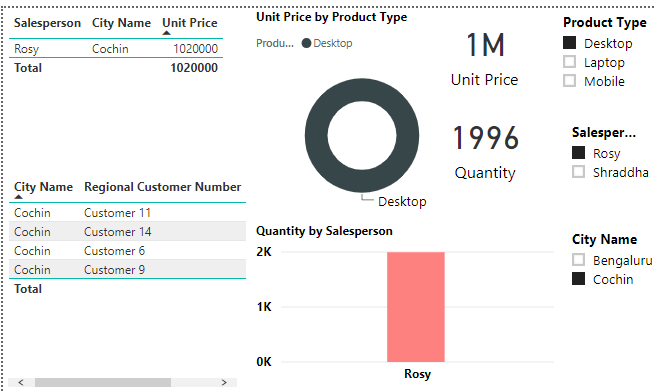
- Let’s try to filter data with Desktop for City Name Cochin and with salesperson Rosy.
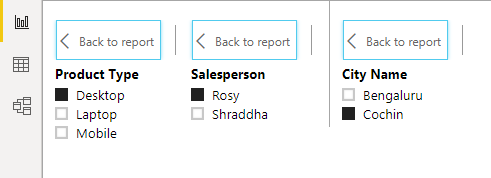
- We will see Rosy has sold 1996 quantities of total price worth 1 Million Rupees of product type Desktop in Cochin.
- So that how it becomes easy to create a dashboard in Power BI and add N number of slicers in it without establishing the connection. Now let’s select any of the slicer which we have created and understand the options and functions available under them.
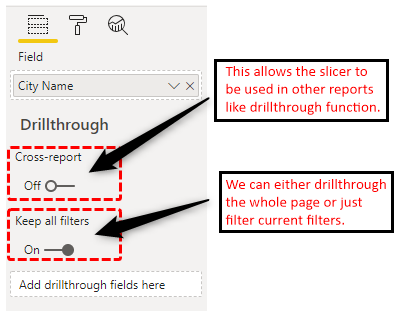
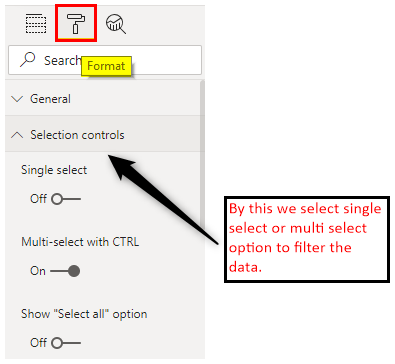
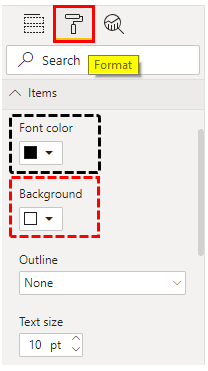
- Under Format, we have other options as well. We will see only important options here only.
- There is another useful option available in the format section which is Item. By this, we can change the color of background and Font as per our theme.
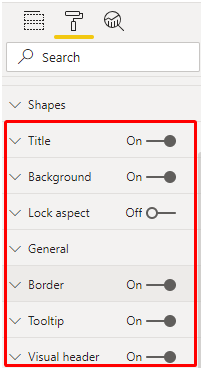
- After that, we have Title, Background, Lock Aspects, Border and Visual Headers. We can turn ON and OFF any of the options from below screen as per our need and see the changes in our slicers. As the names say, all these allow us to activate that function in our dashboard slicers.
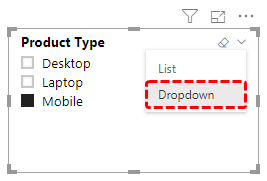
- There is one more important thing to learn. When we click on any slicer, at the right top end we have drop down arrow. If we click on that, we will get a list as shown below. This list allow us to see the fields in Slicer as List or as Dropdown. Currently, we have List view in our slicer. Let’s select Dropdown here.
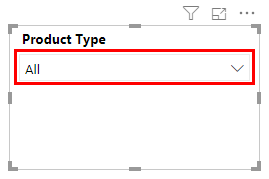
- We will see, our view in Slicer will get changed to Dropdown. And if we click on the down arrow, we will be able to see the all the product types listed under that slicer.
Note: Power BI Slicers file can also be downloaded from the link below and the final output can be viewed.
Pros of Slicer in Power BI
- It is way better than traditional slicer in Excel.
- We don’t have to connect any slicer with any table or chart.
- It is similar to the slicer we use in MS Excel.
- We can even change the orientation of the slicer.
Things to Remember
- Slicers in Power BI are visual filter that directly shows the difference when applied or selected.
- There is no limit of inserting a number of slicers in Power BI.
- Slicer means, cutting off the data which we do not require and project the data which we want to show.
Recommended Articles
This is a guide to Slicers In Power BI. Here we discuss how to Add & format Slicers in Power BI with an example and downloadable template. You may also look at the following articles to learn more –
