Updated March 22, 2023
Introduction to Power BI Filter
A filter is a word we use in MS Excel often to see only a specific set of data. In MS-Excel we are all familiar with the drop-down list to choose only items that are required.
However, when it comes to Power BI we do have a filter drop-down list but when summarizing the data we need to use DAX function i.e. Filter. For example when we have all the city sales if you want to show only one city sales total then we can use FILTER DAX function to get a total of one particular city.
What Does Filter Function do in Power BI?
FILTER is simply the DAX function used to summarize the data with specifies criteria’s. As we have told above when we have all the cities sales if you want to show only one city sales total then we can use FILTER DAX function to get the total of one particular city.
FILTER is mainly used with CALCULATE function, in general, to apply any kind of filters to arrive criteria based totals. Below is the syntax of the FILTER function in Power BI.
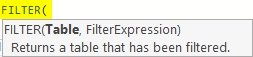
- Table: First we need to mention the table name that we are filtering.
- Filter Expression: In the filtering table what is the thing we need to filter. In case of filtering individual city sales we need to select a city column and by putting equal sign we need to enter the city name in double-quotes.
How to Use Filter DAX Function in Power BI?
Let’s see some of the examples to understand the functionality of the Filter DAX function in Power BI.
Power BI Filter – Example #1
For demonstrating the Filter function consider the below data table that we are going to use. So you can download the excel workbook from the below link which is used for this example.
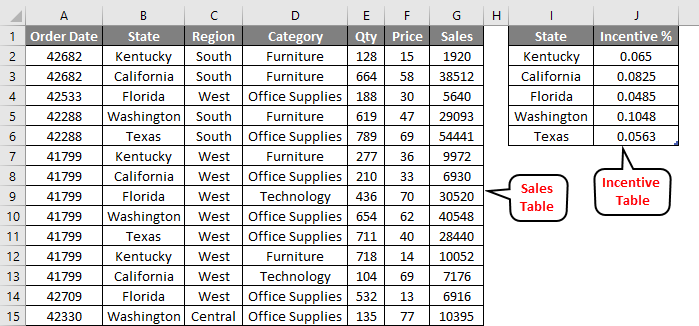
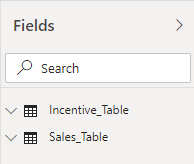
We have two tables “Sales_Table” and “Incentive_Table”.
- Upload these two tables to Power BI Desktop file by downloading the excel workbook.
- Now insert Table visual and create a summary like the below one.
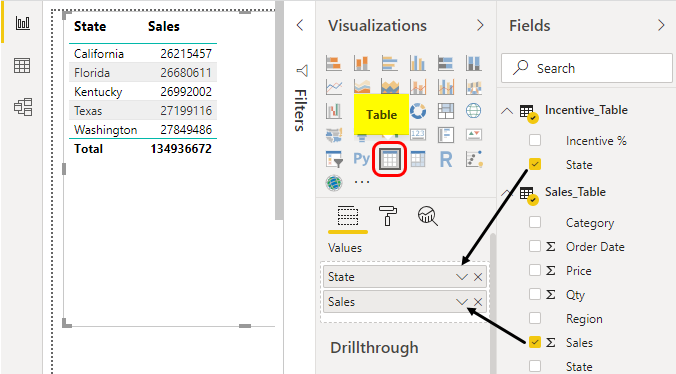
This shows each respective total, now imagine a situation where we need to have a sales summary for each city for the year “2015”. This is where we can include the “FILTER” function to filter only for the year 2015.
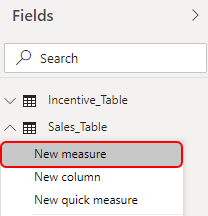
- Right-click on the Sales_Table and choose the New Measure option.
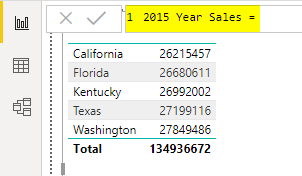
- Give name as the 2015 Year Sales.
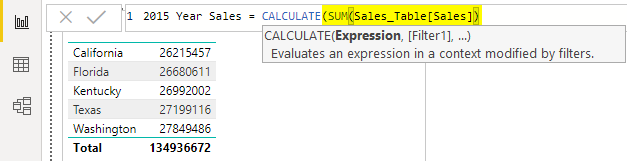
- Since we need to sum sales values for the year 2015, open the CALCULATE function first.
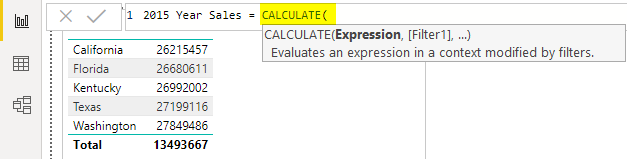
The first argument of the CALCULATE function is Expression i.e. what is the calculation we need to do, so we need to sum sales value column.
- So open SUM function and choose the “Sales” column from “Sales_Table”.
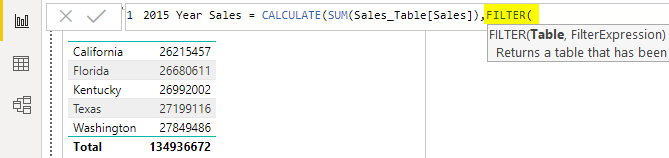
As of now, this will sum the “Sales” column now next argument is Filter1 i.e. while doing the sum of sales column what is the filter condition we need to apply.
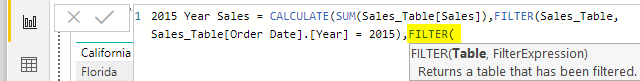
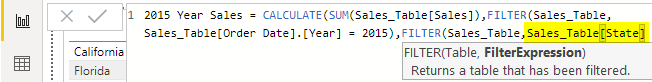
- So open FILTER function to apply filter condition.
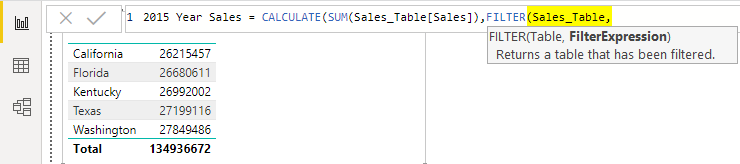
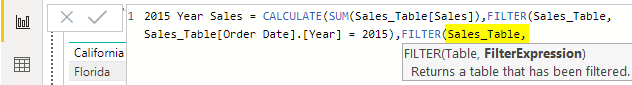
- Mention the table name for which we are applying the filter. The table we are applying a filter for is Sales_Table so choose the same table name.
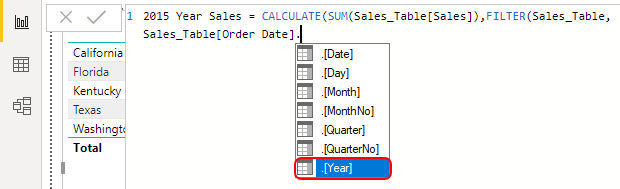
- Filter Expression that we are applying is for the column Order Date, so choose this column.
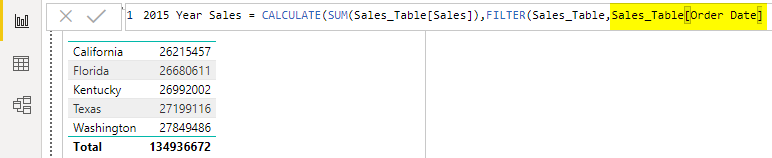
- Since this is a complete date column we need to choose the Year item from this column. So put a dot and choose the Year item.
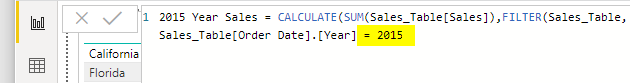
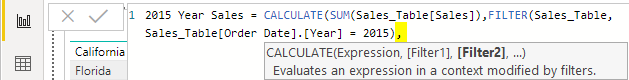
- Now apply the filter criteria as 2015.
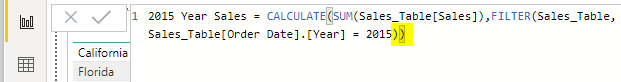
- Close two brackets and hit enter key to get the sales value for the year 2015 only.
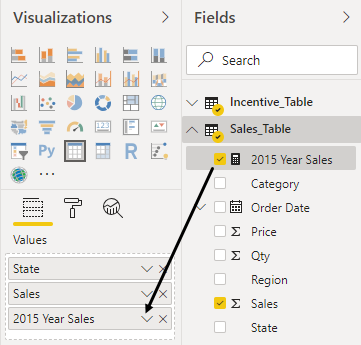
- Drag and drop this new measure i.e. 2015 Year Sales to the table visual to get the year 2015 total for each city.
- This will give visualization as shown below.
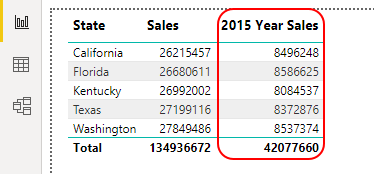
- Now imagine a situation where you need to apply multiple filters, for an example we have already created filter for the year 2015, now let’s say we need to have these sales total only for the state “Texas” in this case we can continue the old formula and after applying FILTER put comma to access next argument of CALCULATE function.
- The next option of the CALCULATE function is Filter 2 so for this open another FILTER function.
- Again choose the table as Sales_Table.
- Filter Expression that we need to apply for the column is “State” so choose the “State” column.
- For this column we need only “Texas” state sales total for the year 2015, so put an equal sign and enter the criteria as Texas.
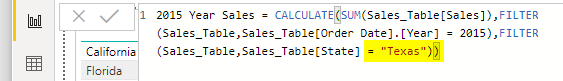
- Now close two brackets and hit enter key to get the total.
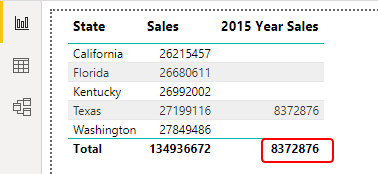
As you can see above since we have edited the existing formula we have sales value only for the city “Texas” and for the year “2015”.
Power BI Filter – Example #2
Now, look at one more example of using FILTER. Assume we need to calculate the incentive amount based on the “State” column, for each state we have different incentive percentage, so we need to fetch the incentive percentage from another table.
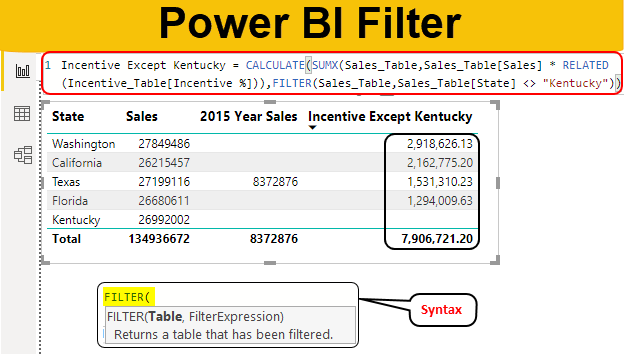
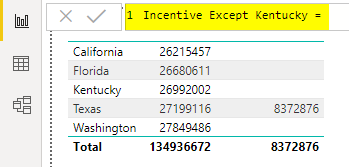
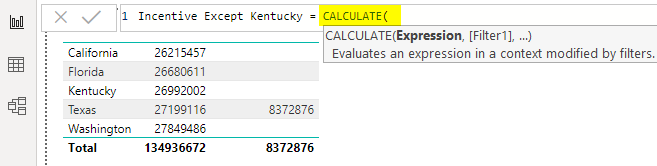
We will use the RELATED function to fetch the incentive details. Assume we need to create a measure that calculates the incentive except for the state “Kentucky”, Right-click on Sales_Table and choose New Measure and give the name as “Incentive Except Kentucky”.
- Open the CALCULATE function.
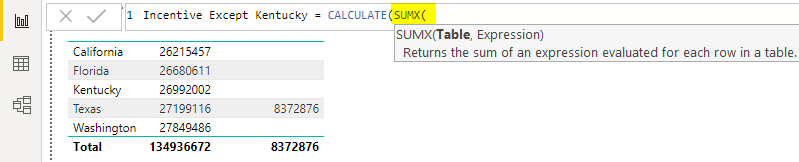
- The calculation that we need to perform is we need to multiply the sales value with incentive percentage which is there in the other table, so open SUMX function.
- Mention the table name.
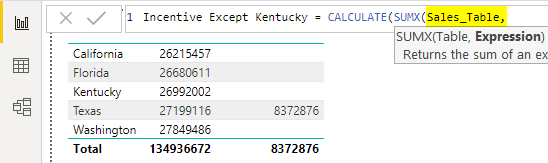
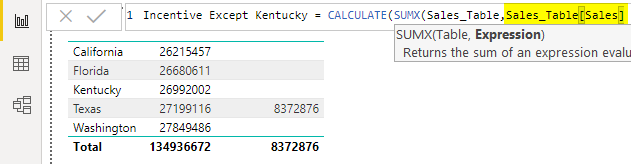
- An expression is nothing but the kind of calculation that we need to do, so first, choose Sale Value column.
- Sales Value column needs to be multiplied with the incentive percentage column from another table, so open RELATED function.
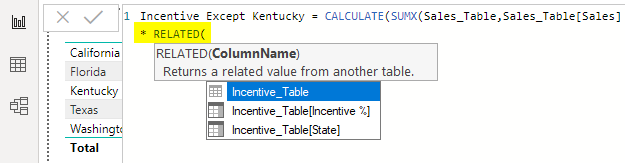
- The Colum Name that we need to choose from Incentive_Table is “Incentive %”, so choose the same.
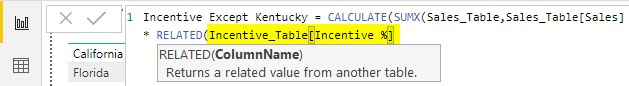
- Close two brackets and this will be the end of the calculation, now open FILTER function.
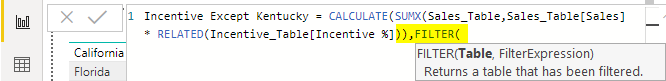
- Mention the table name as Sales_Table.
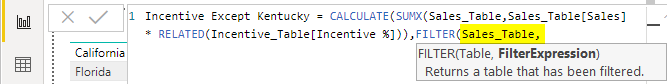
- Filter Expression will be for the state except “Kentucky”, so enter the filter criteria as shown below.
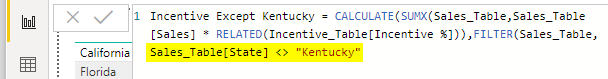
- Ok, that all close the brackets and hit enter key to get the result.
- Drag and drop this new measure i.e. Incentive Except Kentucky to the table visual to get the incentive values.
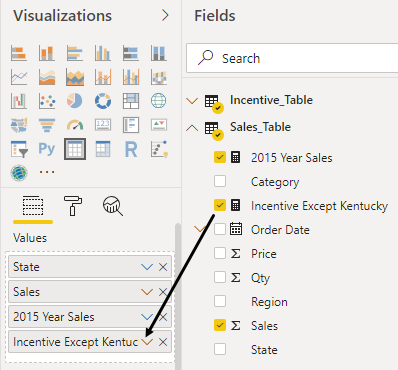
- This will give visualization as shown below.
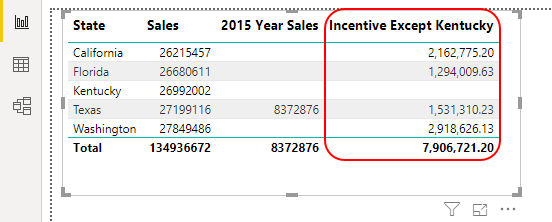
Wow!!! As you can see above we have incentive values for all the states except for the state “Kentucky”.
Things to Remember
- In Power BI, the FILTER function is commonly used with the CALCULATE function.
- A RELATED function is used to fetch the data from another table if there is a relationship between two tables.
Recommended Articles
This is a guide to Power BI Filter. Here we discuss Power BI Filter Function which is used to summarize the data with specifies criteria along with a practical example. You may also look at the following articles to learn more –
