Updated March 21, 2023
Power BI DAX Functions
DAX in Power BI stands for Data Analysis Expressions. It is a formula expression language used in Power BI and other visualization tools as well. It is used for creating different types of formulas. We all have been using different excel functions for a long time in MS Excel. DAX is like the Insert Function of Excel. In DAX, we write the different types of formulas that are used for data modeling Power BI.
As to get the sum of any column data in Excel, we use the Sum function. In a similar way, we use the Sum function in Power BI to get the sum of different and selected columns. It is just an example. Apart from sum we can perform many types of functions and apply many or any type of mathematical function in DAX.
If we know how to use Excel insert functions, then it will be easy for us to use DAX in Power BI. Many people are familiar with the types of data types used in DAX. These data types are the same as those used in Excel such as Integers, Double, String, etc. Also, these data types have different types of function categories as well such as Aggregate, Text, Logical, Counting and Information. And the method of application is the same as the Insert function of MS Excel.
How to Use DAX Formula in Power BI?
To use Power BI DAX formula you need data to work with, so you can download the excel workbook from the below link which is used for this example.
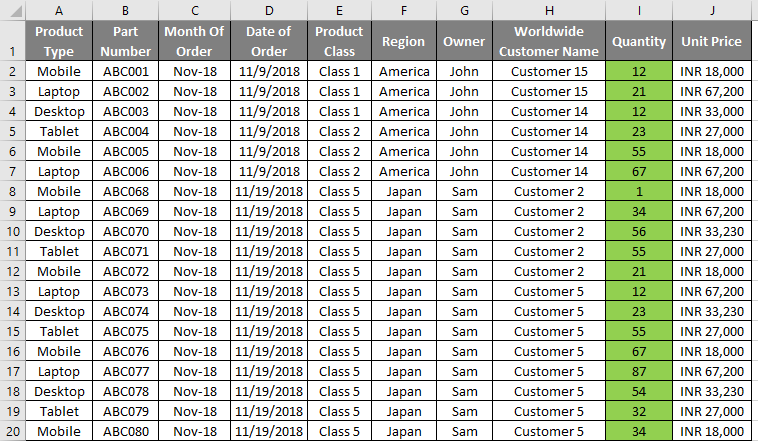
We have a table of sales data of some electronic products such as Mobile, Desktop, Tablet, and Laptop.
Now open Power BI. We will be getting a window to sign up. Skip the window and get into the first home page of Power BI.
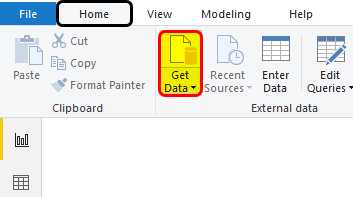
- To import data in Power BI, click on Get Data option which is there in the Home menu bar as shown below.
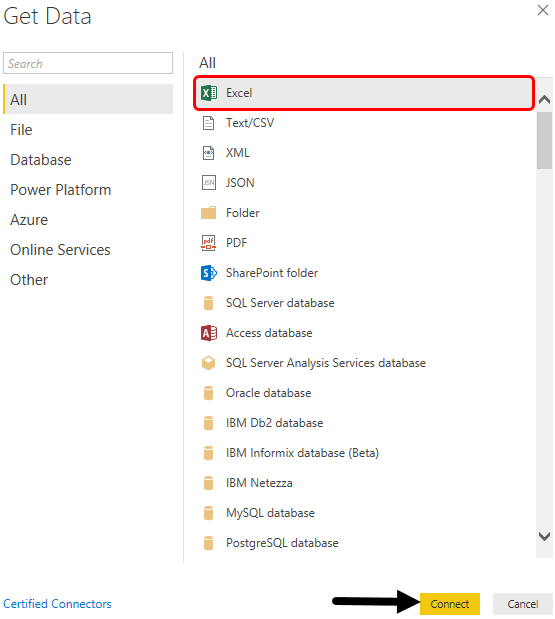
- Now select the type of file which we want to upload. Here, our data is in an excel file. Select the Excel file and click on Connect.
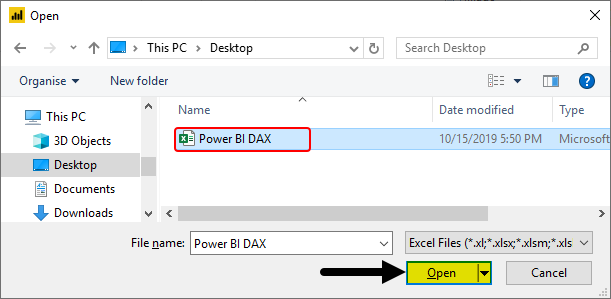
- This will take us to browse window. From there we will search and open the file which we want to upload.
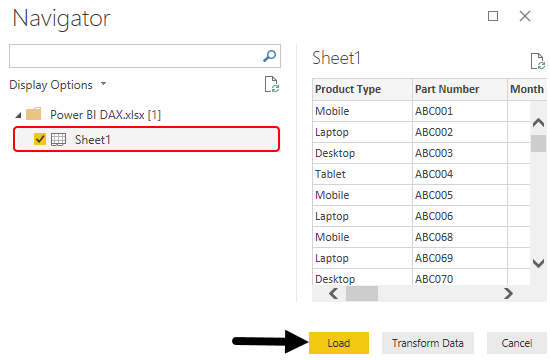
- Now from the Navigator window mark the sheet which we want to select and work on. Here, our sheet is named Sheet1. Once we check the box against the sheet name we will be able to see the data in that sheet. Now click on the Load button. We can choose to transform data if we want to do some changes in data.
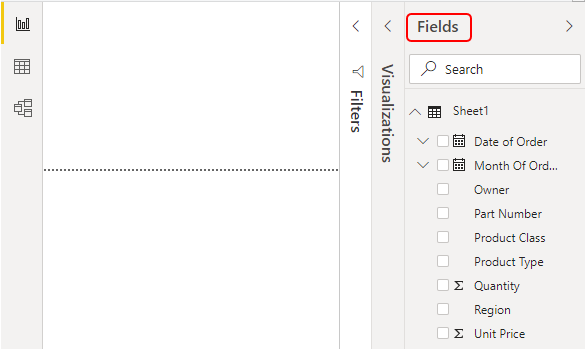
- Once data is uploaded in Power BI, we will be able to see the columns name in Fields section as shown below. This is available on the right-hand side of the window.
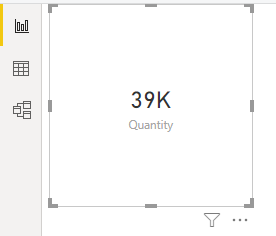
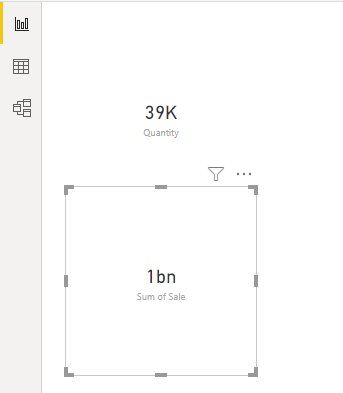
- Select the data that we want to use for calculation. Let’s say that column be Quantity. To see the data, we will select Card visualization.
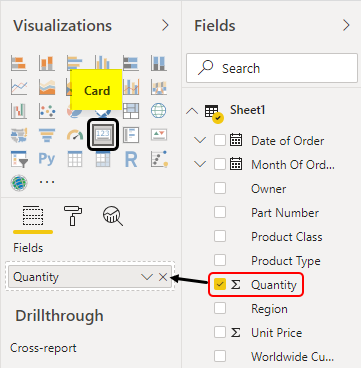
This will give visualization as shown below.
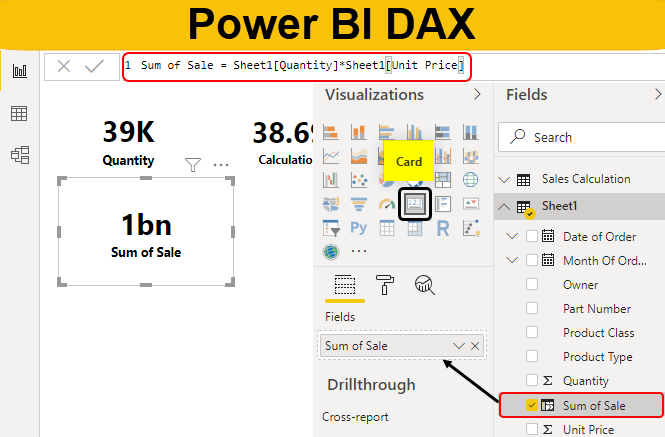
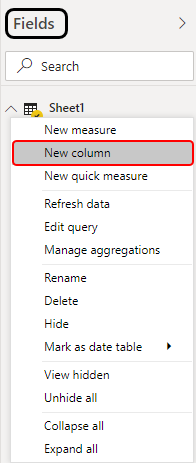
- Now we will insert a new column with the help of DAX in an uploaded column and there we will insert formula for calculating the sum of the sale. For this, create a new column by right-clicking on the sheet name which is there in Fields section.
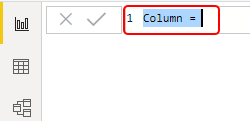
- We will get a similar formula bar field of excel in Power BI. There we will see the name of the column.
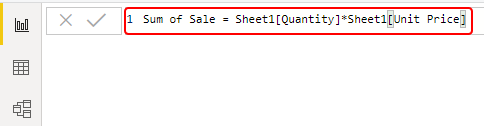
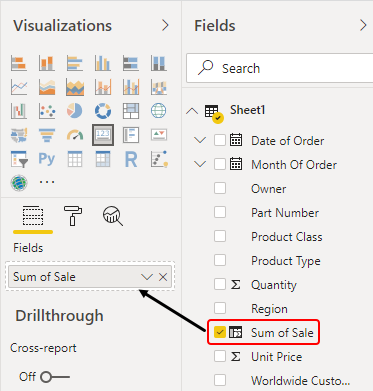
- Now here, we can change the name of the column as per our need. Let say the name be Sum of Sale. To get the Sum of Sale we need to multiply Unit Price and Quantity of Sheet1 like below.
- Now we will select the created column Sum of Sale, in a similar way as we will did above.
We will see, as per the formula used above for the sum of sale, we got the outcome in card visual as 1 Billion.
This is the way of using the Basic simple formula in DAX.
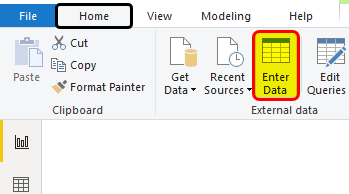
- Now we will be storing the calculated fields. For that go to the Home menu tab and click on Enter Data option as shown below.
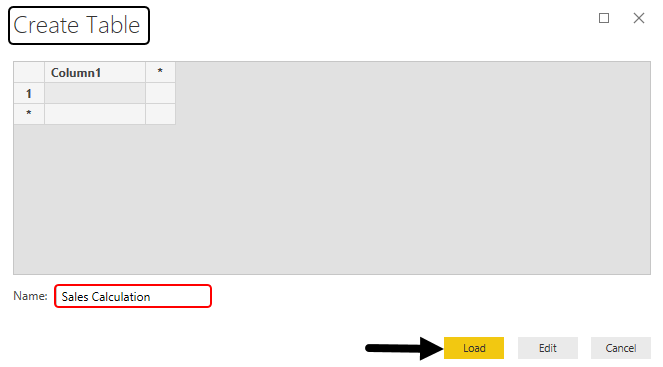
- Now we will get the Create table option. Enter the new name of Table as Sales Calculation and click on Load.
We will see, the fields section is now having the Table that we have created along with the column it has.
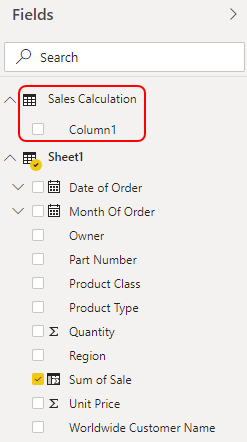
Now the real DAX we will see under the table which we have created.
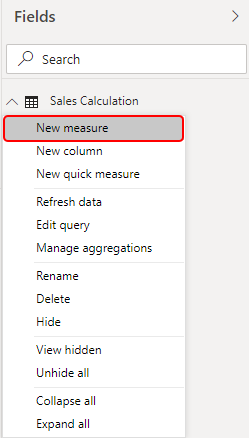
- Right-click on the Sales Calculation table and select a new measure in the name of Calculation.
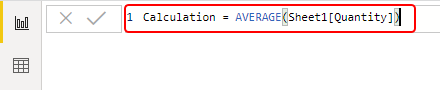
- Insert any function you want. Let say Average and press Enter to confirm.
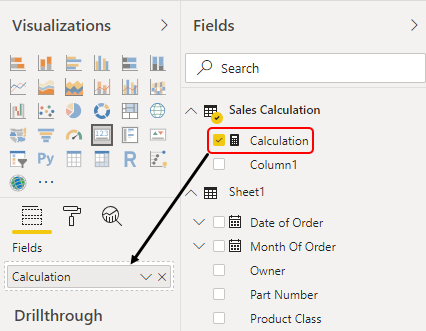
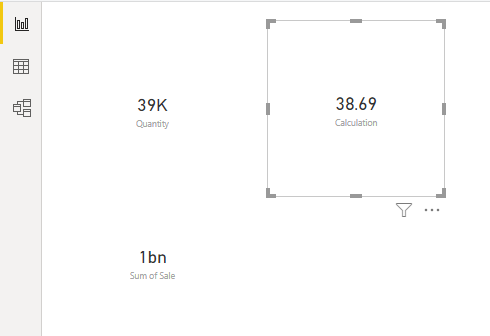
- Now we will select the created measure Calculation, in a similar way as we did above.
As per the formula used, we got the outcome in card visual as 38.69.
This is how we can insert many more functions and formulas in Power BI using DAX. We can try to insert Sum, Count functions as well for better understanding.
Pros of Power BI DAX Function
- It is very easy to use DAX and insert different functions there.
- We can use and link any sheets and functions together.
- The application and use are the same as we use Insert function in MS Excel.
Things to Remember
- DAX is not only used in Power BI but it is also available in different visualization tools.
- DAX functions are the same as MS Excel insert function and also the most of the function in DAX has the same syntax as that of MS Excel functions.
- To work in DAX, we must know the popular Excel function and their syntax, how to apply them.
- DAX uses the same data type as we have used in VBA Macros.
- Syntax of DAX always should start with the name of Sheet which has used while uploading the data in Power BI.
Recommended Articles
This is a guide to Power BI DAX. Here we discuss how to insert DAX formulas for calculation of data in the Power BI along with a practical example. You may also look at the following articles to learn more –
- Excel Hacks | Excel Template
- Convert Excel to CSV (Examples)
- Overview of Excel Mortgage Calculator
- How to Calculate Variance in Excel?
- How to Use Calendar DAX Function in Power BI?
- Power BI IF Statement
- How to Use Filter DAX Function in Power BI?
- Creating Sample Dashboard in Power BI
- Top Features of Power BI for Data Visualization
- Easy Steps of Power BI Charts
