Updated July 27, 2023
Poisson Distribution Formula (Table of Contents)
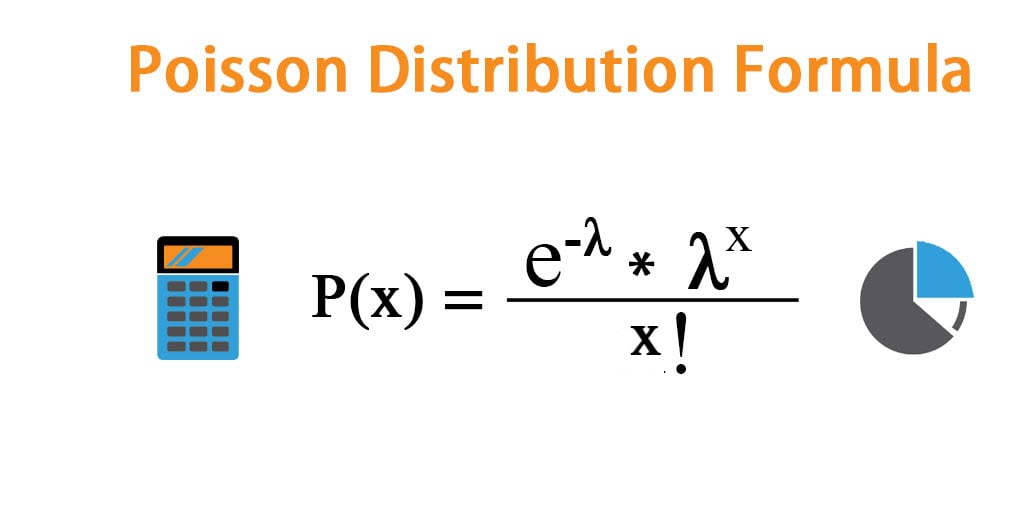
What is the Poisson Distribution Formula?
In Probability and Statistics, there are three distributions based on continuous and discrete data – Normal, Binomial, and Poisson Distributions. Normal Distribution is often seen as a Bell Curve. Poisson distribution is often referred to as the Distribution of rare events.
This is predominantly used to predict the probability of events based on how often the event has happened. It allows for a given number of events occurring in a set of periods. It is used in many real-life situations.
The formula to calculate Poisson distribution is as below:
For x=0, 1, 2, 3…
This experiment generally counts the number of events in the area, distance, or volume. Along with this, one can find the Chain of events, which is nothing but the chain of occurrences of the same event over a particular period of time. The Poisson distribution has the following common characteristics.
- An event can happen any number of times at any time.
- The event can consider volume, area, distance, and time.
- However, the probability of an event happening in any measures specified above is the same.
- Each event is not dependent on all other events, meaning the probability of an event happening does not affect other events happening simultaneously.
Examples of Poisson Distribution Formula
Let’s take an example to understand the calculation of the Poisson Distribution in a better manner.
Poisson Distribution Formula – Example #1
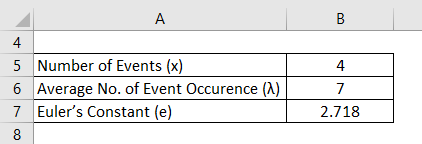
The average yearly accidents at a Railway station platform during train movement is 7. The Poisson distribution formula can be used to identify the probability of exactly 4 incidents on the same platform this year.
Solution:
Poisson Distribution is calculated using the formula given below
P(x) = (e-λ * λx) / x!
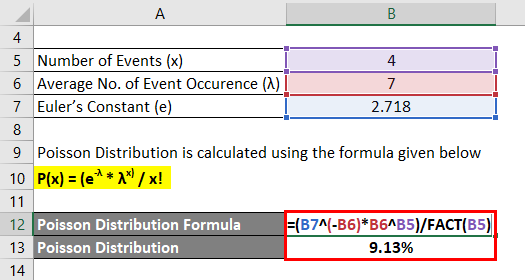
- P (4) = (2.718-7 * 74) / 4!
- P (4) = 9.13%
For the given example, there are 9.13% chance that there will be exactly the same number of accidents that can happen this year.
Poisson Distribution Formula – Example #2
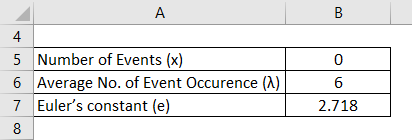
The number of typing mistakes made by a typist has a Poisson distribution. The mistakes are made independently at an average rate of 2 per page. Find the probability that a three-page letter contains no mistakes.
Here average rate per page = 2, and the average rate for 3 pages (λ) = 6
Solution:
Poisson Distribution is calculated using the formula given below
P(x) = (e-λ * λx) / x!
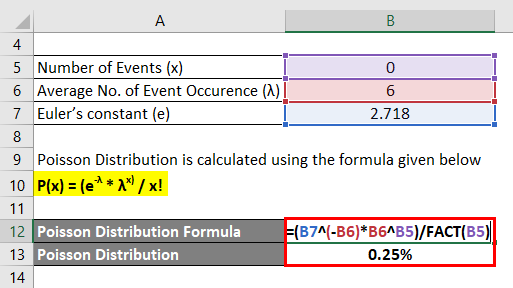
- P (0) = (2.718-6 * 60) / 0!
- P (0) = 0.25%
Hence there is a 0.25% chance that there will be no mistakes for 3 pages.
Explanation
Below is the step-by-step approach to calculating the Poisson distribution formula.
Step 1: e is the Euler’s constant which is a mathematical constant. Generally, the value of e is 2.718.
Step 2: X is the number of actual events that occurred. It can have values like the following. x = 0,1,2,3…
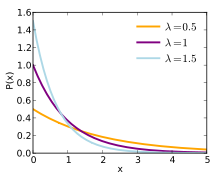
Step 3: λ is the mean (average) number of events (also known as “Parameter of Poisson Distribution). Suppose you take the simple example of calculating λ => 1, 2,3,4,5. If you apply the same data set in the above formula, n = 5, hence mean = (1+2+3+4+5)/5=3. For a large number of data, manually finding the median is impossible. So it is essential to use the formula for many data sets. Here in calculating the Poisson distribution, usually, we will get the average number directly. Based on the value of the λ, the Poisson graph can be unimodal or bimodal like below.
Step 4: x! is the Factorial of events that happened x. Below is an example of how to calculate factorial for the given number.
Take the simple example for calculating the Factorial of the real data set => 1, 2,3,4,5.
- x! = x * (x-1) * (x-2) * (x-3) *…… 3*2*1
- 5! = 5 * (5-1) * (5-2) * (5-3) * (5-4)
- 5! = 5*4*3*2*1
- 5! = 120
Relevance and Uses of Poisson Distribution Formula
Poisson distribution can work if the data set is a discrete distribution, each and every occurrence is independent of the other occurrences that happened, describes discrete events over an interval, events in each interval can range from zero to infinity and mean a number of occurrences must be constant throughout the process. Depending on the value of the Parameter (λ), the distribution may be unimodal or bimodal. The Poisson distribution is discrete, which means the event can only be stated as happening or not as happening, meaning the number can only be stated in whole numbers. Fractional occurrences of the event are not part of this model. The outcome results can be classified as success or failure. This is widely used in the world of:
- Data Analytics for Predictive Analysis of Data
- Stock Market predictions
- Sales Market predictions
- Supply and Demand chain predictions
- Readily available on Amazon Web Services (AWS) platforms
- Review and evaluate business insurance coverage
Other applications of the Poisson distribution are from more open-ended problems. For example, it may help determine the minimum resources needed in a call center based on average calls received and calls on hold. In short, the list of applications can be added more and more as it is used worldwide for practical statistical purposes.
Poisson Distribution Formula Calculator
You can use the following Poisson Distribution Calculator
| λ | |
| x | |
| P(x) | |
| P(x) = | (e-λ * λx) / x! | |
| (0-0 * 00) / 0! = | 0 |
Poisson Distribution Formula in Excel (With Excel Template)
Here we will do another example of the Poisson Distribution in Excel. It is very easy and simple.
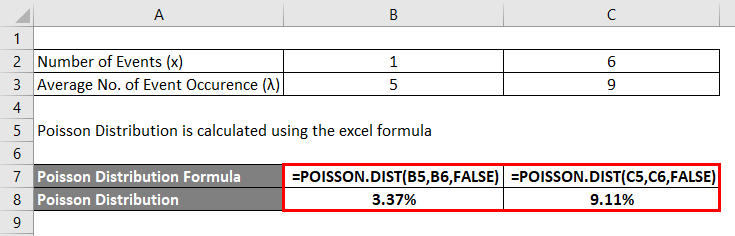
Calculate the Poisson Distribution in Excel using the function POISSON.DIST.
Below is the Syntax of the Poisson Distribution formula in Excel.
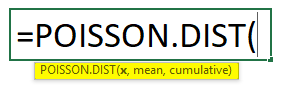
The Poisson distribution has the following argument:
Where,
- x = Number of occurrences for which probability needs to be known.
- Mean = Average number of occurrences during the time period.
- Cumulative = Its value will be False if we need the exact occurrence of an event and True if the number of random events will be between 0 and that event.
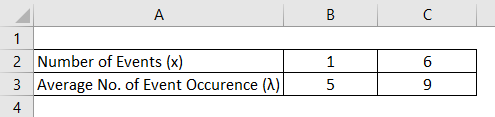
Poisson Distribution is calculated using the Excel formula
Recommended Articles
This has been a guide to Poisson Distribution Formula. Here we discuss How to Calculate Poisson Distribution along with practical examples. We also provide a Poisson Distribution Calculator with a downloadable Excel template. You may also look at the following articles to learn more –
