Updated June 2, 2023
Variance Analysis Formula (Table of Contents)
What is the Variance Analysis Formula?
Variance analysis is a pretty important formula in portfolio management and other financial and business analyses. We can measure the quantitative formula as the difference between planned and actual numbers. The formula is heavily used in cost analysis to check the variance between the planned or the standard cost versus the actual cost. The analysis helps the management to keep a check on the company’s operational performance.
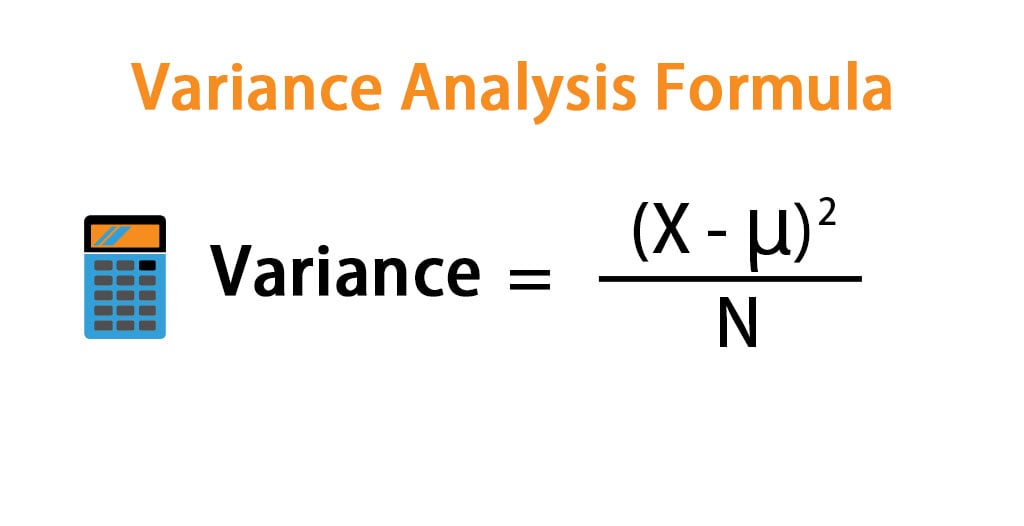
The formula For Variance Analysis is given below
- X stands for the value of individual data point
- µ stands for the average or the mean of the individual data point
- N stands for the number of individual data points in a given array
Variance analysis formula is used in a probability distribution set up and variance as also be defined as the measure of risk from an average mean. Variance also depicts how much the investor is able to assume the risk when purchasing a specific security.
Examples of Variance Analysis Formula (With Excel Template)
Let’s take an example to understand the calculation of the Variance Analysis in a better manner.
Example #1
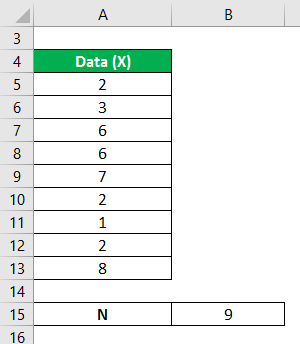
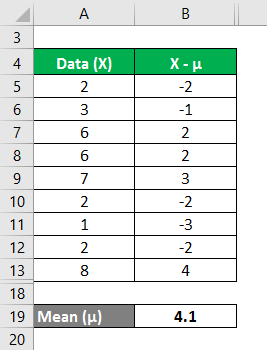
Consider a data set having the following observations 2,3,6,6,7,2,1,2,8. We need to calculate the variance analysis.
The solution to the following problem can be solved by taking the following steps:
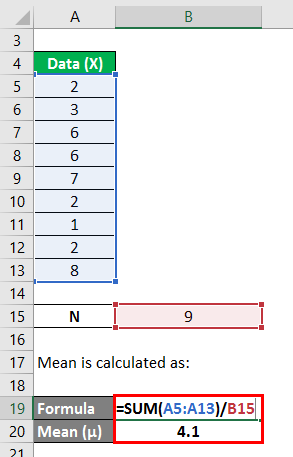
The mean is calculated as follows:
We must calculate the difference between the data points and the mean value.
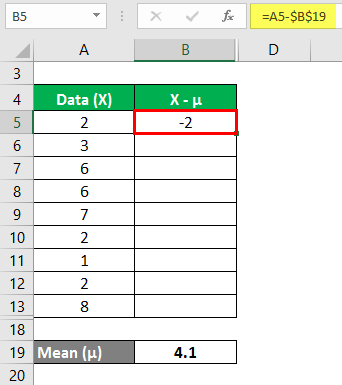
Similarly, calculate all values of the data set.
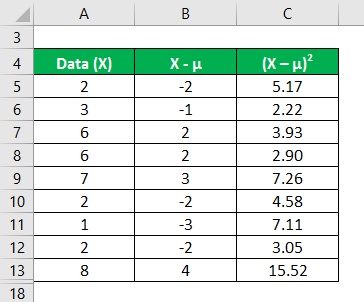
Calculate the square of the difference between data points and the mean value.
Variance Analysis is calculated using the formula given below
Variance = (X – µ)2 / N
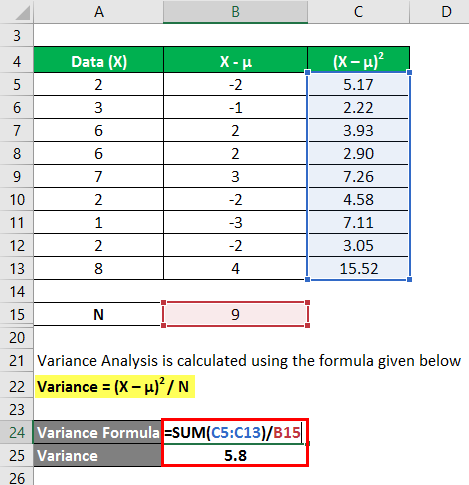
In the first step, we calculated the mean by summing (2+3+6+6+7+2+1+2+8)/number of observations, giving us a mean of 4.1. Then in column 2, we calculated the difference between the data points and the mean value and squaring each value individually. After that, summing up column C and dividing it by the number of observations gives us a variance of 5.8.
Example #2
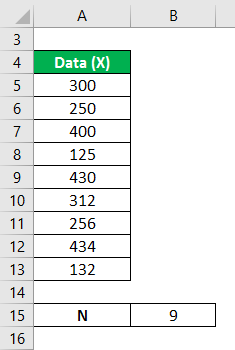
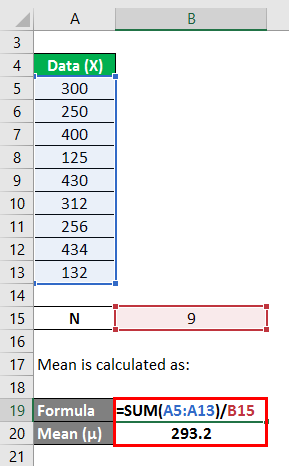
The heights of the dogs in a given set of random variables are 300 mm, 250 mm, 400 mm, 125 mm, 430 mm, 312 mm, 256 mm, 434 mm, and 132 mm. Calculate the variance analysis of the data set from the mean.
The solution to the following problem can be solved by taking the following steps:
Mean is calculated as:
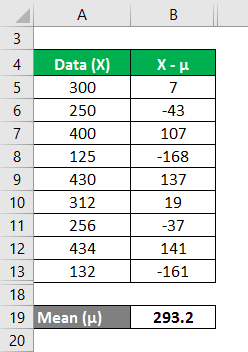
We must calculate the difference between the data points and the mean value.
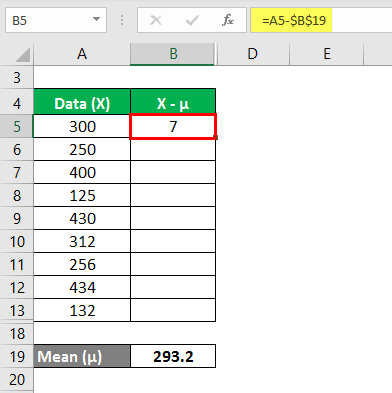
Similarly, calculate for all values of the data set.
Calculate the square of the difference between data points and the mean value.
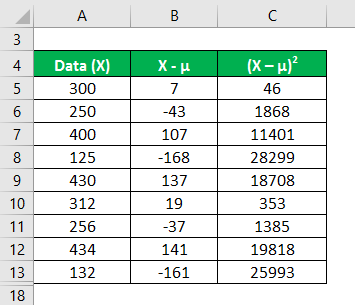
We calculate Variance Analysis using the formula provided below
Variance = (X – µ)2 / N
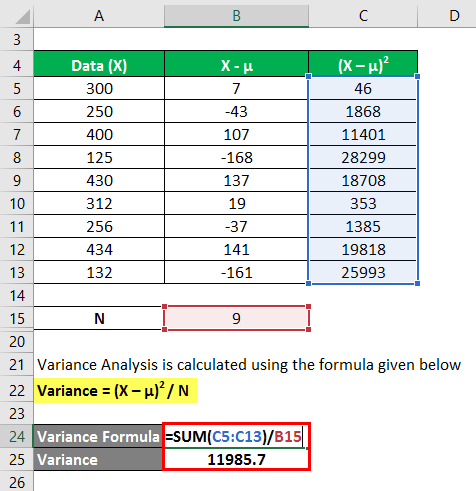
In the first step, we calculated the mean by summing (300+250+400+125+430+312+256+434+132)/number of observations, giving us a mean of 293.2. Then in column 2, we calculated the difference between the data points and the mean value and squaring each value individually. After that, summing up column C and dividing it by the number of observations gives us a variance of 11985.7.
Example #3
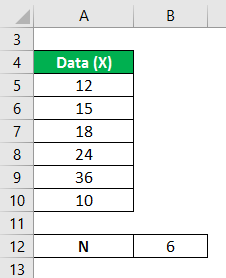
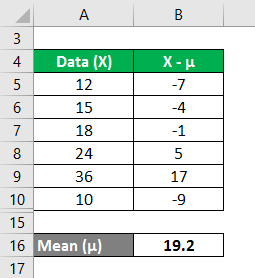
The marks gained by the students selected from a large sample of 100 students are 12, 15, 18,24,36, and 10. Calculate the variance analysis of the data from the mean.
The solution to the following problem can be solved by taking the following steps:
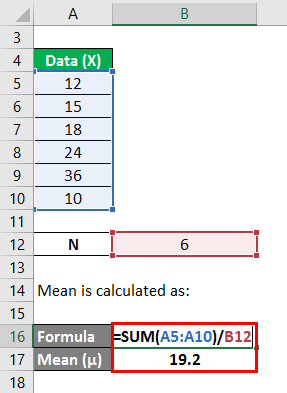
We calculate the mean as follows:
We must calculate the difference between the data points and the mean value.
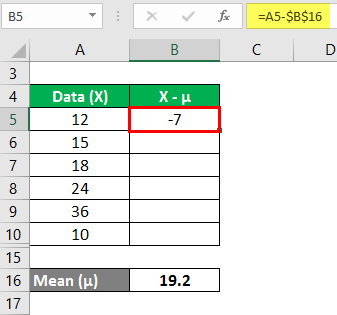
Similarly, calculate for all values of the data set.
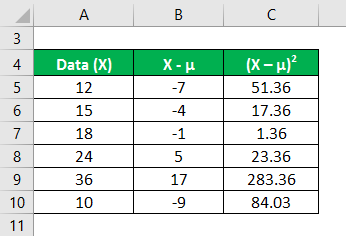
Calculate the square of the difference between data points and the mean value.
We calculate Variance Analysis using the formula provided below
Variance = (X – µ)2 / N
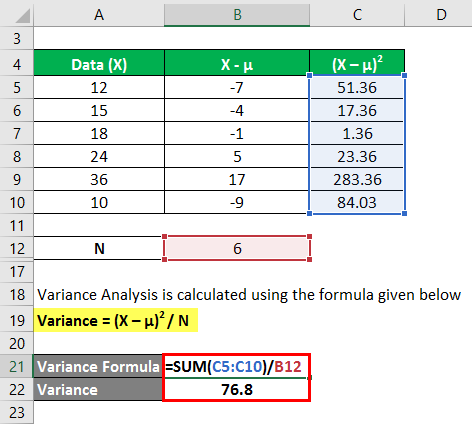
In the first step, we calculated the mean by summing (12+15+18+24+36+10)/number of observations, giving us a mean of 19.2. Then in column 2, we calculated the difference between the data points and the mean value and squaring each value individually. After that, summing up column C and dividing it by the number of observations gives us a variance of 76.8
Explanation
We calculate the variance analysis formula using the following steps:-
Step 1: Calculate the mean of the number of observations present in the data array, which can be calculated by a simple mean formula which is the sum of all the observations divided by the number of observations.
Step 2: After calculating the mean of the observations, we subtract the mean from each observation to calculate each observation’s deviation from the mean.
Step 3: We sum and square the difference of each observation to avoid negative-positive signage and then divide it by the number of observations.
Relevance and Uses of Variance Analysis Formula
We can use variance analysis in the following areas:-
- Portfolio Management
- Calculation of stock and portfolio return
- The business frequently uses the comparison of Budget vs Actual Cost.
- Forecasting of cost and revenue
- Materiality
- Relationships between two variables
Recommended Articles
This has been a guide to Variance Analysis Formula. Here we discuss how to calculate the Variance Analysis along with practical examples and a downloadable Excel template. You may also look at the following articles to learn more –
