Standard Normal Distribution Formula (Table of Contents)
- Standard Normal Distribution Formula
- Examples of Standard Normal Distribution Formula (With Excel Template)
- Standard Normal Distribution Formula Calculator
Standard Normal Distribution Formula
Standard Normal Distribution is a random variable that is calculated by subtracting the mean of the distribution from the value being standardized and then dividing the difference by the standard deviation of the distribution.
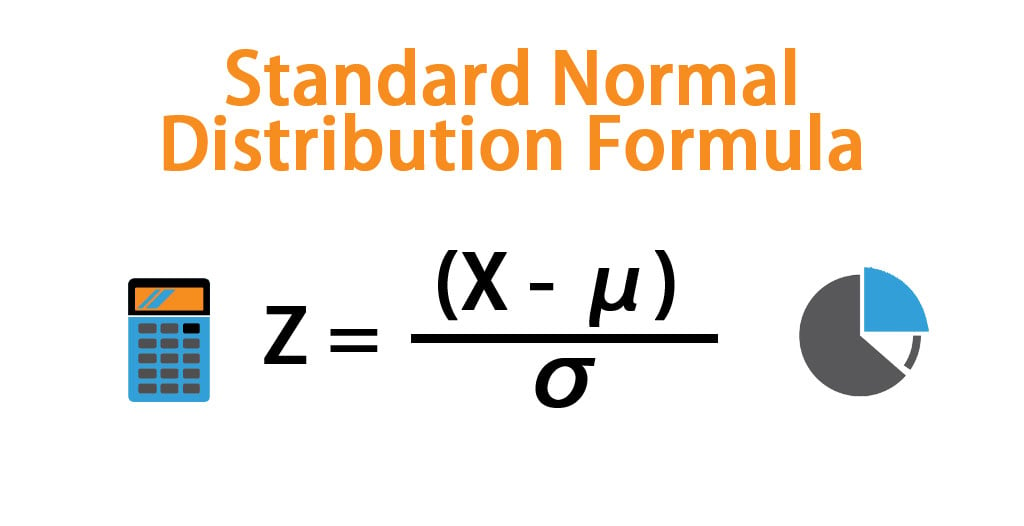
The Formula of Standard Normal Distribution is shown below:
Where,
- Z: Value of the standard normal distribution,
- X: Value on the original distribution,
- μ: Mean of the original distribution
- σ: Standard deviation of the original distribution.
Examples of Standard Normal Distribution Formula (With Excel Template)
Let’s take an example to understand the calculation of the Standard Normal Distribution in a better manner.
Standard Normal Distribution Formula – Example #1
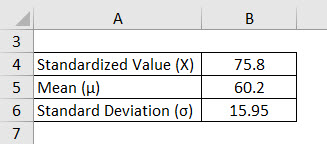
A particular mean is given, and the data randomly stands at 60.2 and the Standard deviation at 15.95. Find out the probability of getting a value higher than 75.8.
Solution:
Standard Normal Distribution is calculated using the formula given below
Z = (X – μ) / σ
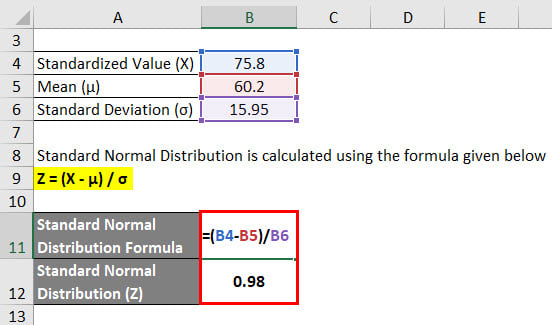
- Standard Normal Distribution (Z) = (75.8 – 60.2) / 15.95
- Standard Normal Distribution (Z) = 15.6 / 15.95
- Standard Normal Distribution (Z) = 0.98
P(X > 75.8) = P(Z > 1) = [Total area] – [ Left of z] = 1
= 1 – 0.98 = 0.2
The probability of the random value, which is more than 75.8, is equal to 0.2
Standard Normal Distribution Formula – Example #2
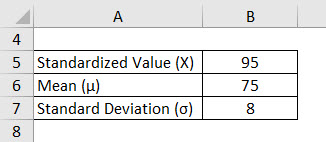
A motor-bike travels at a top speed of 120 Km/ hr, whereas the minimum speed is 30 km/hr. Thus, the average speed at which the motor-bike travels is 75 km/hr. If the Standard deviation is 8, find the probability of the motor-bike with a speed more than 95 km/hr.
Solution:
Standard Normal Distribution is calculated using the formula given below
Z = (X – μ) / σ
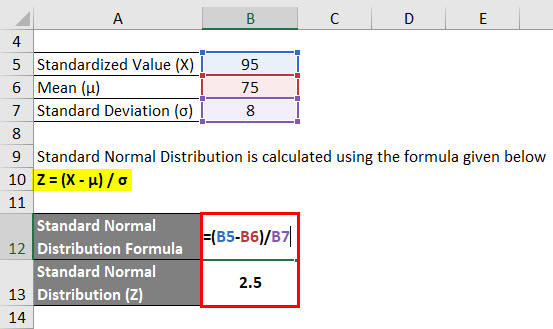
- Standard Normal Distribution (Z) = (95 – 75) / 8
- Standard Normal Distribution (Z) = 20 / 8
- Standard Normal Distribution (Z) = 2.5
The probability that a motorbike would travel at a speed of more than 95 Km/Hr is 2.5.
Standard Normal Distribution Formula – Example #3
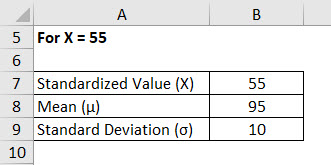
The average marks scored by candidates in the English test for a particular class is 95, and the standard deviation is 10. Find the probability of a random score falling between 55 and 85.
Solution:
For X = 55
Standard Normal Distribution is calculated using the formula given below
Z = (X – μ) / σ
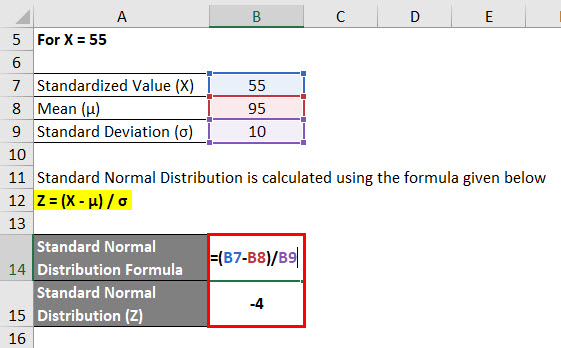
- Standard Normal Distribution (Z) = (55 – 95) / 10
- Standard Normal Distribution (Z) = -40 / 10
- Standard Normal Distribution (Z) = -4
For X = 85
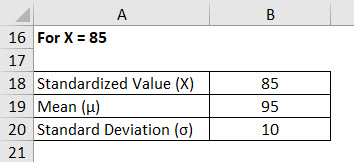
Standard Normal Distribution is calculated using the formula given below
Z = (X – μ) / σ
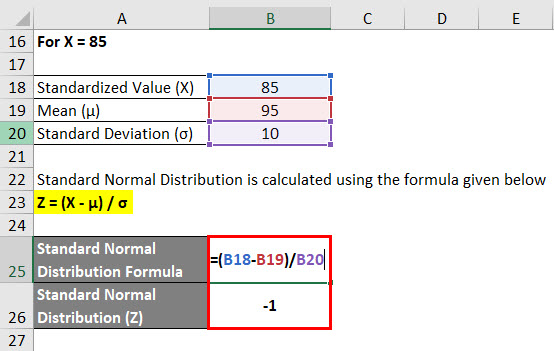
- Standard Normal Distribution (Z) = (85 – 95) / 10
- Standard Normal Distribution (Z) = -10 / 10
- Standard Normal Distribution (Z) = –1
Thus the probability is P (-4 < z <-1)
Explanation
Continuous and discrete distribution is essential in statistics and probability theory and is used very often. A normal distribution is applied in randomly used in social and natural science for representing real-valued random variables. Those variables have certain conditions of their own, which are unknown and is a very common continuous probability distribution. Everything depends upon the way of data distribution. The direction of data distribution can be done from the center to left or right. If the entire values in a particular distribution are transferred to Z scores, then in the results, we would get an SD of 1 and a mean of 0.
Z represents standardize random variables along with all the profanities which are associated with the ranges of values of Z, which are given in the distribution table. As per the formula, any random variable is standardized by deducting the mean of the distribution from the value being standardized and then dividing this difference by the standard deviation of the distribution. After that, a normally distributed random variable has a mean of zero and a standard deviation of one.
Relevance and Uses of Standard Normal Distribution Formula
Standard Distribution is broadly used in detecting the probabilities of score occurrence within normal distribution and which can be compared with the normal distribution points. This is a very useful tool that is frequently used in the Statistical Department in determining several aspects from different data.
Some of the Aspects were essential at marketing, digital marketing, knowing the characteristics of an object which has some probability distribution, and so on. These are essential features from which one can identify the traits and mannerisms of consumers so that the Business can offer the right product at the right time. The Research and Development team would create the products as per the needs of the customer based on their traits and buying methods. Thus, in each and every aspect, this formula helps to understand the essence of the customer’s needs, and hence the Research and Development team works accordingly to support the demand and supply. Again, from the producer’s point of it is again required to see the cost of production as well.
The probability which has the possibility of happening in the near future on the basis of historic values and the desired results that can happen will be addressed by the Z score probability formula. It gives a rough idea by which one can predict the future occurrence, and based upon this; the functional changes can be made by the person or by the organization. This formula helps any organization to find out the pockets of opportunities that can be exploited by the business entities for the growth in business. In spite of getting a probable result, it is not accurate as it denotes the future results, not the exact results. Thus, the organization takes necessary steps if anything goes wrong as well.
Standard Normal Distribution Formula Calculator
You can use the following Standard Normal Distribution Calculator
| X | |
| µ | |
| σ | |
| Z | |
| Z = |
|
|
Recommended Articles
This has been a guide to the Standard Normal Distribution formula. Here we discuss how to calculate Standard Normal Distribution along with practical examples. We also provide a Standard Normal Distribution calculator with a downloadable excel template. You may also look at the following articles to learn more –
