Updated July 1, 2023
What is the Horizontal Analysis Formula?
The term “Horizontal Analysis” refers to the method of analyzing financial statements where historical data from the income statement, balance sheet, and cash flow statement are subject to comparison. This comparison shows how each line item has changed in absolute terms or as a percentage change year over year (Y-o-Y).
Using this formula, the analyst can determine the percentage change between two years for any given financial statement line item. This calculation helps identify trends and fluctuations in financial performance, which is useful in making informed business decisions.
Formula
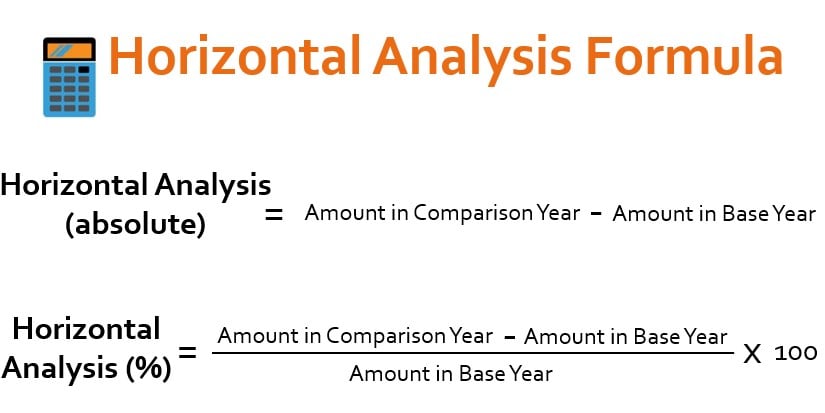
We can derive the formula for horizontal analysis (absolute terms) by deducting the amount in the base year from the amount in the comparison year. Mathematically, we represent it as,
The formula for horizontal analysis (% change) can be derived by dividing the difference between the amount in the comparison year and the base year’s amount in the base year. Mathematically, we represent it as,
Example of Horizontal Analysis Formula (With Excel Template)
Example #1
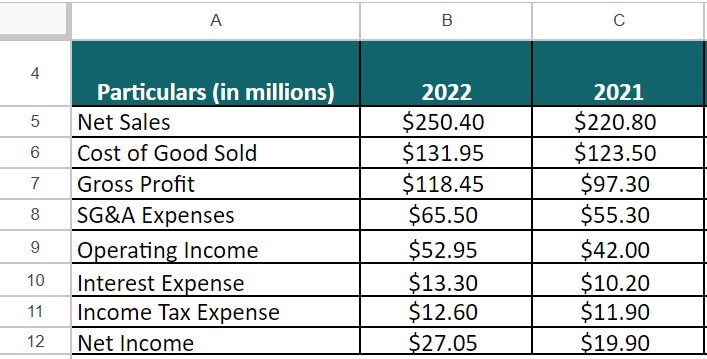
ASD Inc. manufactures precision components for Tier-I OEMs (Original equipment manufacturers). We have the data of its income statement from its latest annual report. Let’s perform a horizontal analysis.
Given,
Solution:
To perform a horizontal analysis of ASD Inc.’s income statement data, we will use the following formula:
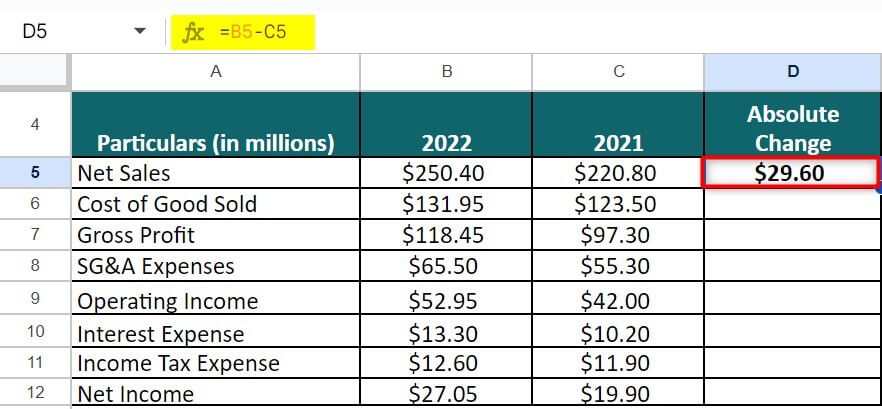
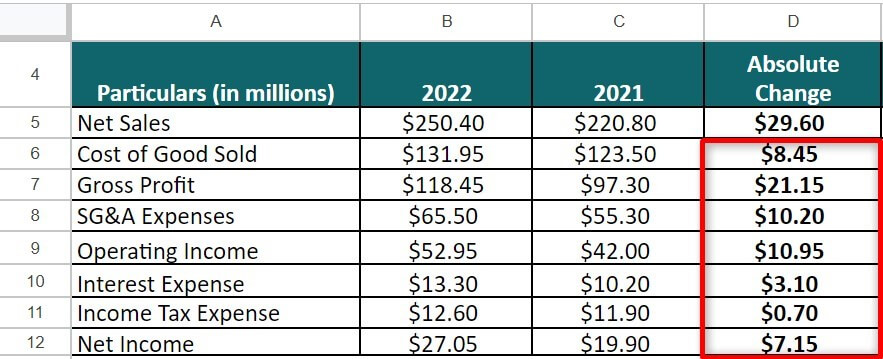
We will apply this formula to each line item to calculate its absolute change.
To calculate the percentage change, we will use the following formula:
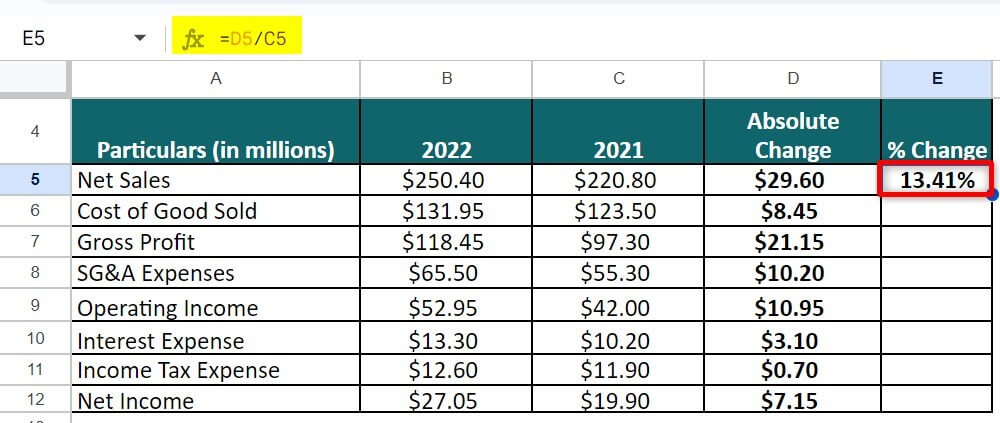
We will also apply this formula to each line item to calculate its percentage change.
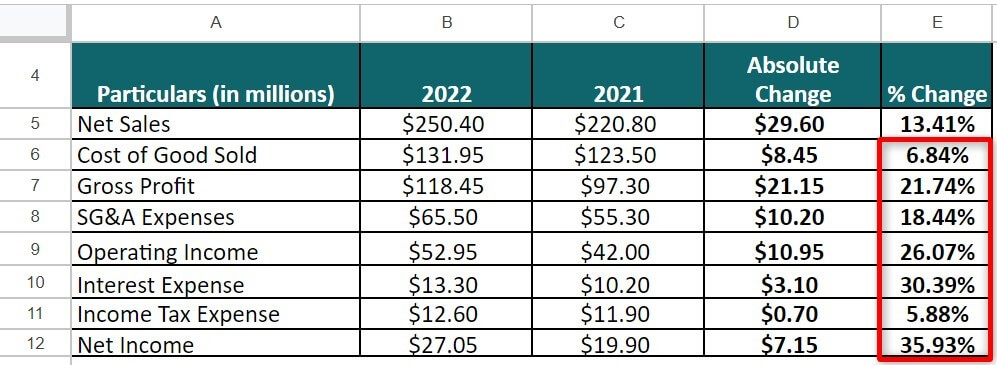
Based on the results, we can conclude that:
- The percentage change in gross profit has been relatively higher than that of net sales due to a lower increase in the cost of goods sold.
- Operating income and net income have also witnessed higher growth due to a lower increase in SG&A expense and income tax, respectively.
Example #2
Let us take the annual report of Apple Inc. for the year 2022 to illustrate the financial statement’s preparation of horizontal analysis. In this case, we will be using the income statement, and accordingly, the following information is taken from the annual report:
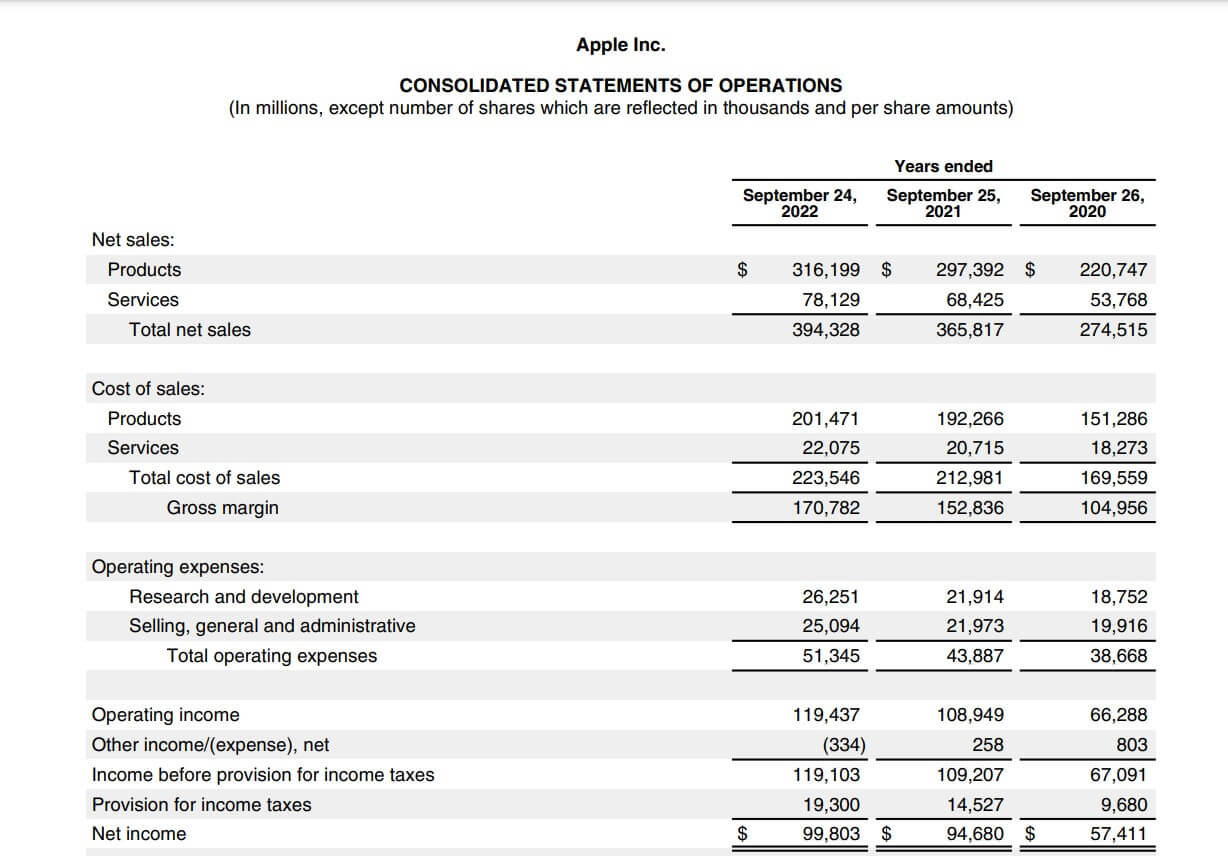
(Source: Annual Report of Apple Inc. for FY22)
Given,
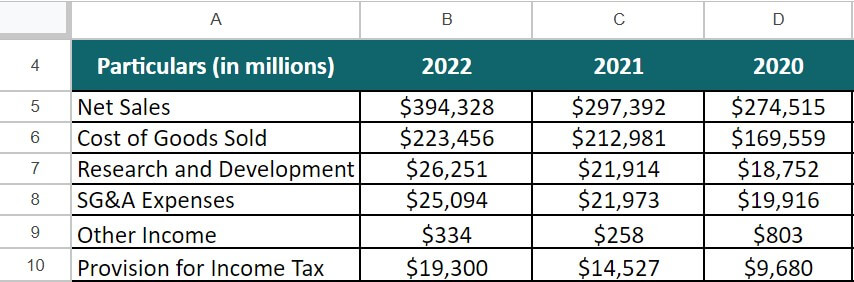
Solution:
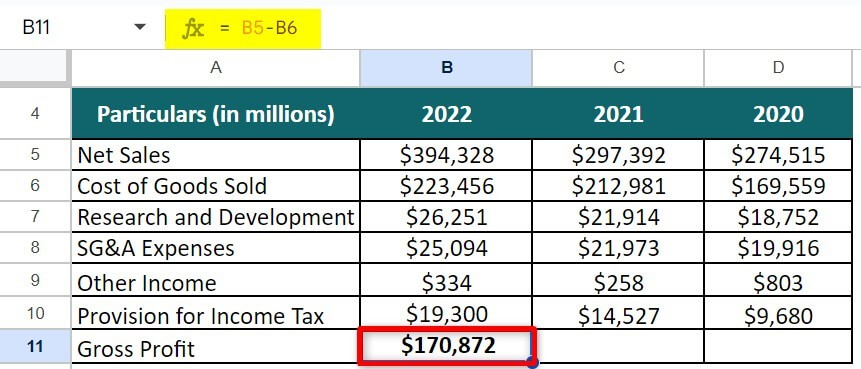
First of all, we will calculate the gross profit:
Gross Profit = Net Sales – Cost of Sales
= $394,328 – $223,456
= $170,872 (for FY22)
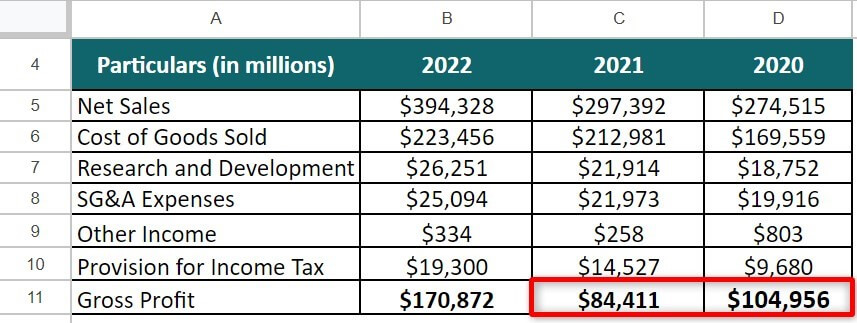
Similarly, we will do the calculation for FY2021 and FY2020:
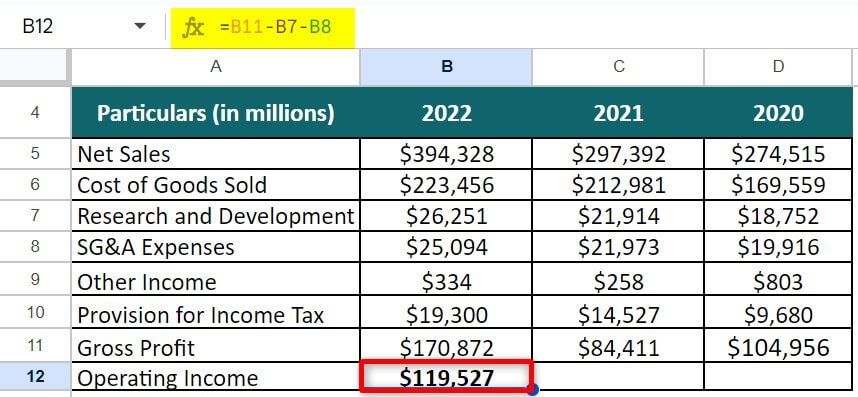
Next, we will calculate the operating income:
Operating Income = Gross Profit – Research and Development – SG&A Expense
= $170,872 – $26,251 – $25,094
= $119,527 (for FY22)
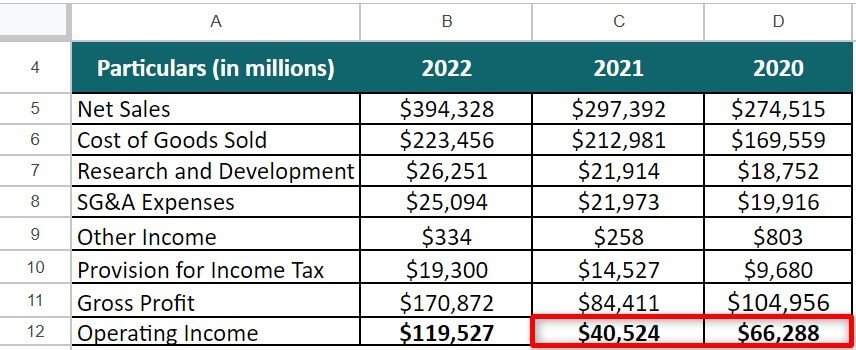
Similarly, we will do the calculation for FY2021 and FY2020:
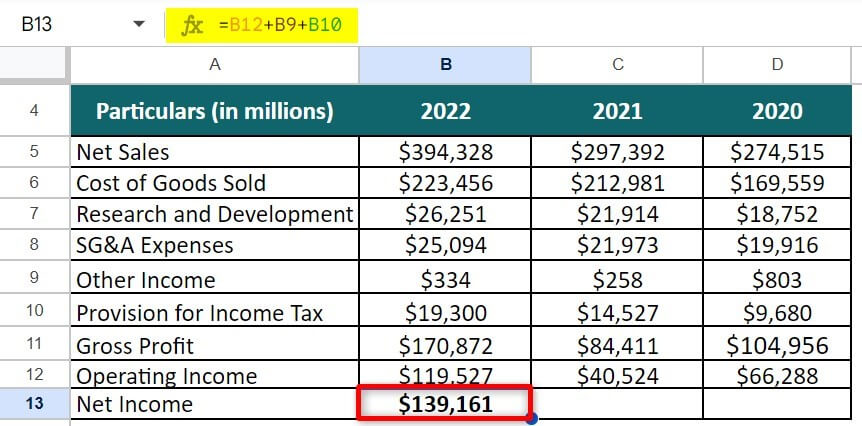
Now, we will calculate the Net Income:
Net Income = Operating Income + Other Income + Provision for Income Tax
= $119,527 + $334 + $19,300
= $139,161 (for FY22)
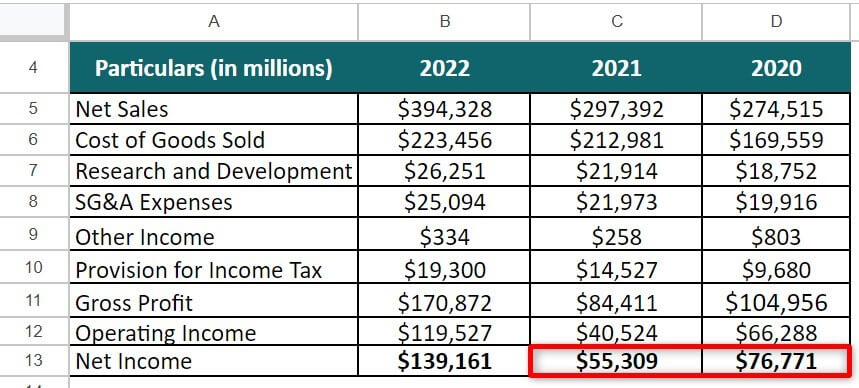
Similarly, we will calculate Net income for FY2021 and FY2020:
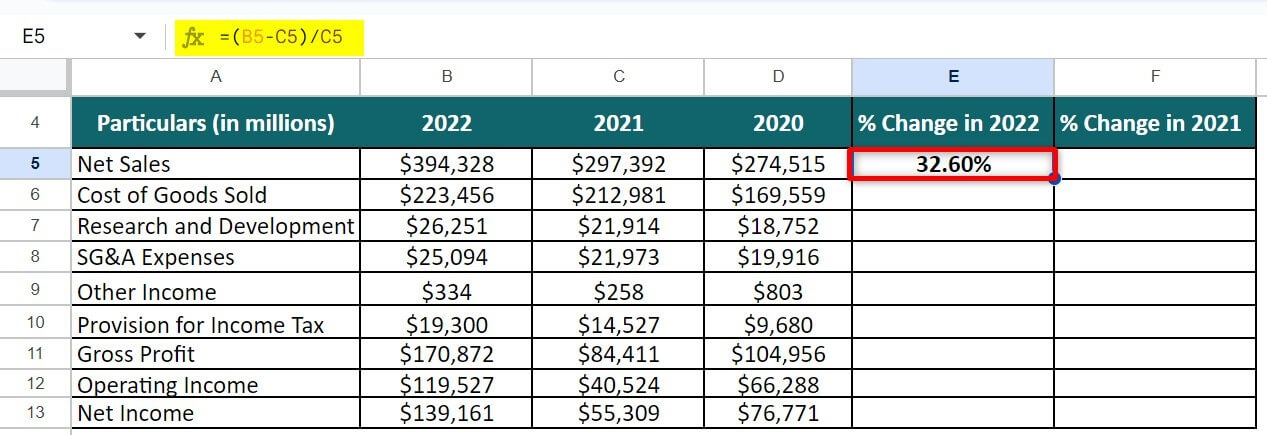
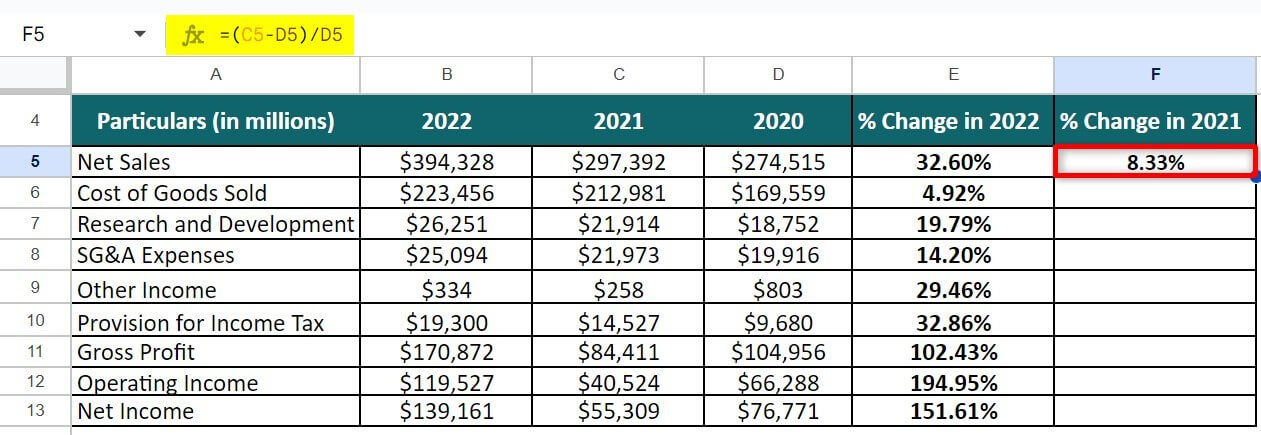
Now, we will calculate the horizontal analysis using the formula given below:
Horizontal Analysis (%) = [(Amount in Comparison Year – Amount in Base Year) /
Amount in Base Year] * 100
= [($394,328 – $297,515)/ $297,515]*100
= 32.60%
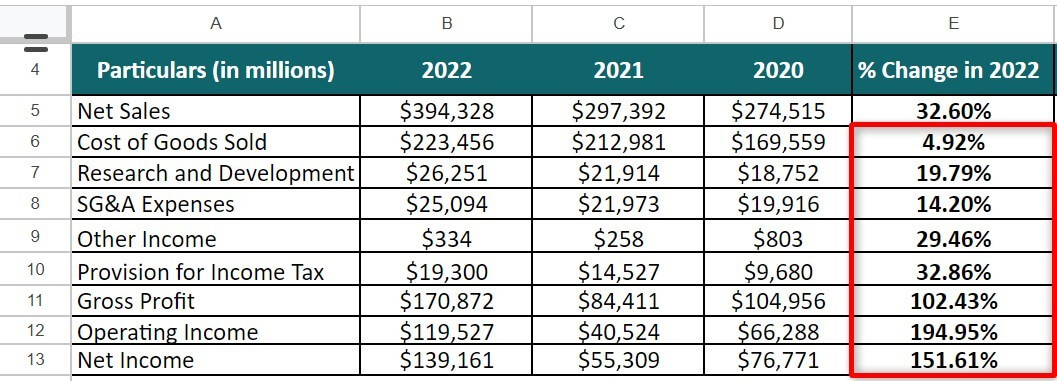
Similarly, we will calculate for the further items too by dragging the formula vertically:
Similarly, we will calculate for FY2021:
Likewise, we will then calculate % change for other particulars by dragging the formula vertically:
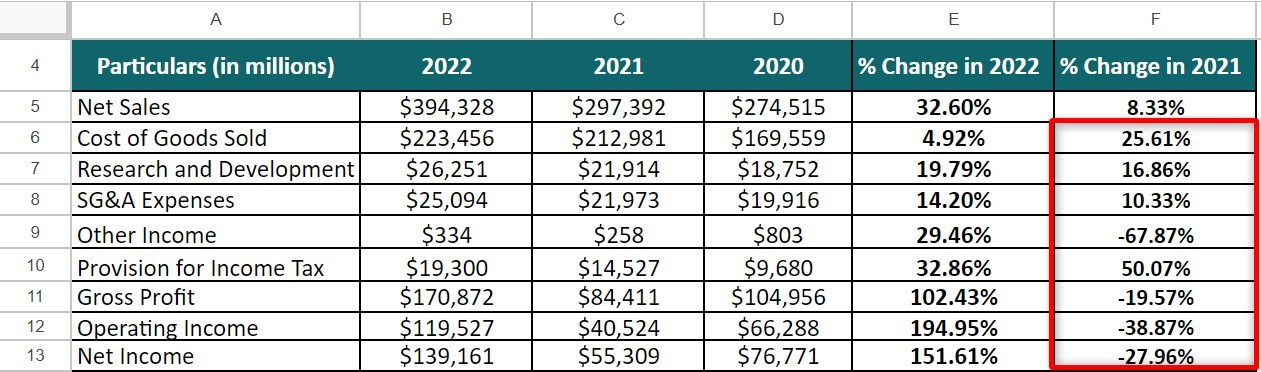
From the analysis done above, we can draw the following conclusions:
- The overall growth has been relatively higher in the year 2022 compared to that of the year 2021. Nevertheless, it indicates that the company has witnessed continuous growth in the last two years.
- Further, it is also noticed that the operating income moves in tandem with the revenue growth, which is a good sign.
Relevance and Use of Horizontal Analysis Formula
It is important to understand the horizontal analysis concept for the following reasons:
- It helps in determining the trend in each line item Y-o-Y. Any sharp deviation in trend may indicate some anomaly in reporting that requires immediate investigation. It is useful in assessing a company’s performance over a period. This analysis technique can provide an overall picture of where the subject company stands regarding financial matters.
- Horizontal analysis helps analyze trends in financial statements and identify areas of strength or weakness in a company’s performance over time.
- We can apply the formula to various financial statements, including balance sheets, income statements, and cash flow statements. It is helpful in comparing the performance of different companies in the same industry.
- It is a valuable tool for financial analysts and investors seeking to understand a company’s financial performance over time. Using this formula, analysts can identify trends and patterns in financial data that can inform their investment decisions and help them make more informed decisions about the company’s prospects.
Horizontal Analysis Formula Calculator
Use the following calculator for Horizontal Analysis Formula calculations.
| Amount in Comparison Year | |
| Amount in Base Year | |
| Horizontal Analysis (absolute) = | |
| Horizontal Analysis (absolute) = | (Amount in Comparison Year - Amount in Base Year) |
| = | (0 - 0 ) = 0 |
Frequently Asked Questions (FAQs)
Q1. How do you calculate a horizontal analysis?
Answer: To calculate a horizontal analysis, you can use the following formula:
(Current Year Amount – Base Year Amount) / Base Year Amount x 100%
The formula calculates the percentage change between the current year amount and the base year amount for each line item in a financial statement. The percentage change indicates how much the line item has increased or decreased over time.
Q2. What is the formula for horizontal and vertical analysis?
Answer: The formulas for horizontal and vertical analysis are as follows:
Horizontal Analysis= (Current Year Amount – Base Year Amount) / Base Year Amount x 100%
Refer to the prior sections to learn more about the horizontal analysis formula.
Vertical Analysis: (Line Item Amount / Total Amount) x 100%
The vertical analysis formula calculates the proportion or percentage of a line item relative to the total amount on a financial statement. This analysis compares line items within the same financial statement and identifies each item’s relative importance.
Q3. How are the results of horizontal and vertical analysis interpreted?
Answer: The interpretation of the results of horizontal and vertical analysis involves analyzing the changes and trends in a company’s financial statements over time and understanding the significance of these changes.
Recommended Articles
This is a guide to Horizontal Analysis Formula. Here we discuss how to calculate the Horizontal Analysis along with practical examples. We also provide a Horizontal Analysis calculator with a downloadable Excel template. You may also look at the following articles to learn more –
