Updated July 31, 2023
Break Even Analysis Formula (Table of Contents)
What is the Break Even Analysis Formula?
A Break-Even point is where the total cost of a product or service equals total revenue. It calculates the margin of safety by comparing the revenue value with covered fixed and variable costs associated with sales.
A break-even point is a saturation point where the company neither makes a profit nor a loss. So, it is the relation between variable cost, fixed cost, and revenue. Break-Even points in units is the fixed cost upon contribution margin per unit.
It can be expressed as:
Example of Break Even Analysis Formula (With Excel Template)
Let’s take an example to understand the calculation of Break Even Analysis in a better manner.
Break Even Analysis Formula – Example #1
The fixed cost of the product is $1,000, and the contribution margin per unit is $100. Calculate Break Even points in the unit.
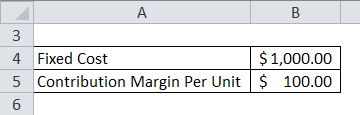
Formula to calculate Break Even Point in Units is as below:
Break Even Point in Units = Fixed Cost / Contribution Margin per Unit
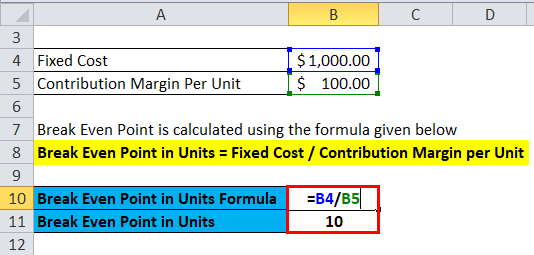
Put the value in the formula.
- Break Even Point in Units =$1000 / $100
- Break Even Point in Units = 10
The Break Even point is 10 units.
Contribution Margin per Unit
The contribution margin of a product is the difference between selling price minus variable cost, and the formula of contribution margin per unit can be written as:-
Contribution Margin per Unit = Sales Price per Unit – Variable Cost per Unit
So, the formula of Break Even points in a unit can be as below:-
Break Even Analysis Formula- Example #2
A product has a fixed cost of $50,000, the variable cost per unit of product is $200, and the selling price per unit is $400. Now let us calculate Break Even point.
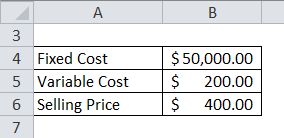
Break Even Point in Units = Fixed Cost / Sales Price per Unit – Variable Cost per Unit

Put a value in the formula.
- Break Even Point in Units = $50,000 / ($400 – $200)
- Break Even Point in Units = $50,000 / $200
- Break Even Point in Units = $250
The Break Even point is 250 units.
Break Even Points in Dollars
The Break Even formula in sales in dollars is calculated by sales price per unit into Break Even point in units. It gives the total amount of sales in order to achieve zero loss or zero profit. It helps to calculate the number of units sold in order to achieve profitability which one gets after Break Even point.
Break Even Analysis Formula – Example #3
A Break, Even point of a product, is 500, and the sales price per unit is $100 now; let us find Break Even point in dollars.
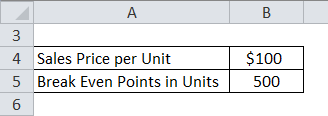
Formula to calculate Break Even Point in dollars is as below:
Break Even Point in Dollars = Sales Price per Unit * Break Even points in Units.

Put a value in the formula.
- Break Even Point in Dollars = 500 * $100
- Break Even point in Dollars = $50,000
So, Break Even point in dollars is $50,000.
Number of Units to Produce the Desired Profit –
This is an analysis of Break Even Point. It helps to find the number of units one needs to sell in order to produce profit without taking the fixed cost into consideration. The number of units to produce the desired profit is the sum of Break Even point of the unit and desired profit in dollars upon contribution margin per unit.
Break Even Analysis Formula- Example #4
The desired profit against sales of the product is $100,000, the contribution margin per unit of product is $200, and the value of Break Even point unit is 2,500. Now, let us calculate no of a unit to produce the desired profit.
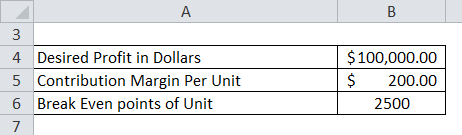
No. of Units to Produce the Desired Profit is calculated using the formula below.
Number of Units to Produce the Desired Profit = (Desired Profit in Dollars / Contribution Margin Per Unit )+ Break Even points of Unit
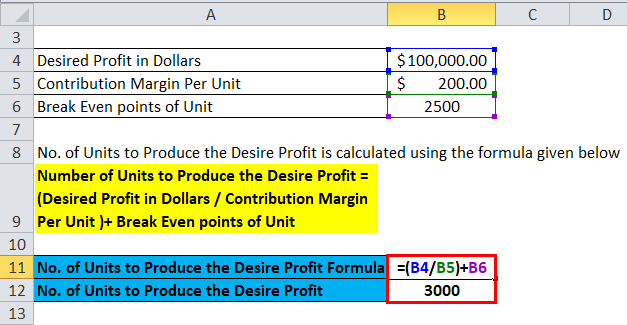
Put a value in the above formula.
- No. of Units to Produce the Desired Profit = (100,000 / 200) + 2500
- No. of Units to Produce the Desired Profit = 3,000
So, 3000 units are required to produce to get the desired profit.
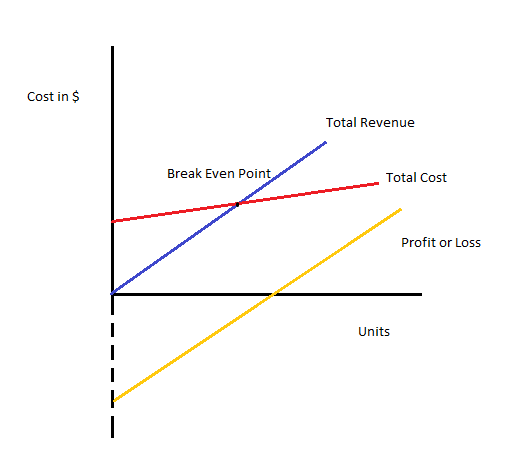
Break Even Chart
Break Even point is where the total cost of a product or service equals total revenue. The difference between total revenue and total cost is profit or loss. Now let’s see the below graph. Through this, one can compute the profit or loss of the company.
Now, let us take another example.
Break Even Analysis Formula- Example #5
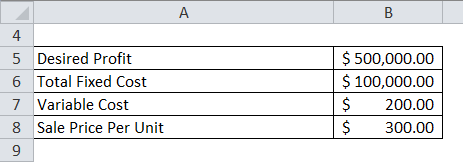
A factory wants to study Break Even point and wants to generate a profit of $500,000. The total fixed cost of a product is $100,000, the variable cost per unit is $200, sales price per unit is $300.
Solution:
Break Even Point in Units = Fixed Cost / Sales Price per Unit – Variable Cost per Unit
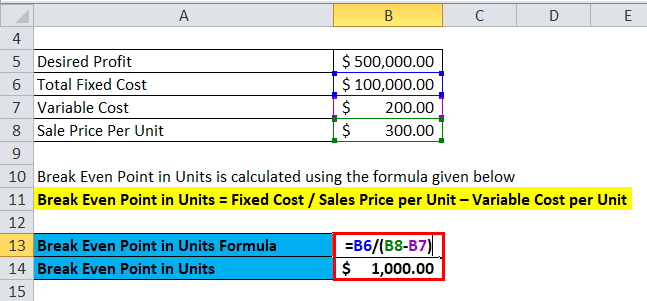
- Break Even Point in Units = 100,000 / (300 – 200)
- Break Even Point in Units = 100,000 / 100
- Break Even Points in Units = $1000
Then, calculate Break Even Point in Dollars
Break Even Point in Dollars = Sales Price per Unit * Break Even points in Units.

- Break Even Point in Dollars = 300 * 1000
- Break Even Point in Dollars = $300,000
Then, calculate the Number of Units to Produce Desired Profit
No. of Units to Produce the Desired Profit is calculated using the formula given below
Number of Units to Produce the Desired Profit = (Desired Profit in Dollars / Sales Price per Unit – Variable Cost per Unit )+ Break Even points of Unit
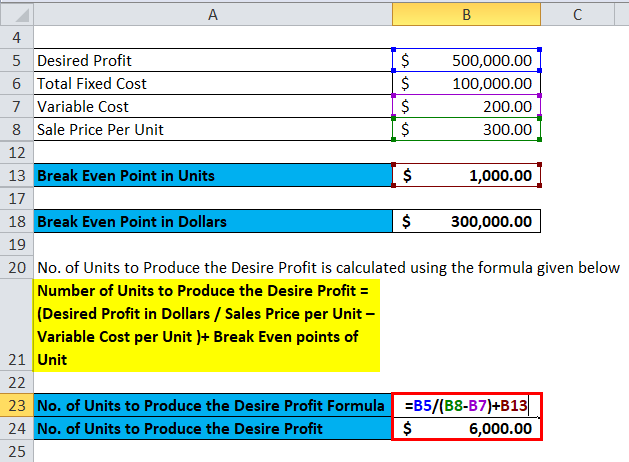
- No. of Units to Produce the Desired Profit = [500,000 / (300 -200) ]+ 1,000
- No. of Units to Produce the Desired Profit = 6,000
Break Even Analysis Formula – Example #6
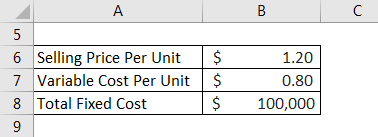
Let us take the example of a widget manufacturing company to illustrate the concept of break-even analysis. The company is in the process of setting up a new unit where it has a budgeted annual fixed cost of $100,000. On the other hand, the variable cost per unit is expected to be $0.80, which primarily consists of the cost of raw materials and direct labor expenses. Determine the break-even point of the company’s new unit if the selling price of each widget is expected to be $1.20.
Solution:
Formula to calculate Break Even Point is as below:
Break Even Point = Total Fixed Costs / (Selling Price per Unit – Variable Cost per Unit)
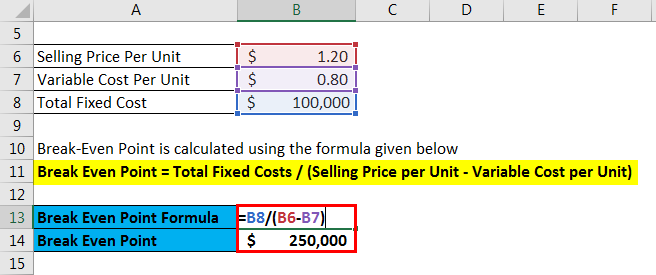
- Break Even Point = $100,000 / ($1.20 – $0.80)
- Break Even Point = $250,000
Therefore, the company needs to sell at least 250,000 widgets from the new unit in order to break even.
Relevance and Uses
There are multiple uses of the Break Even Analysis formula. They are as follows:-
- It helps to decide the price of a product.
- Break Even points help to make crucial financial decisions in business.
- Break Even Analysis formula computes the production unit for a profit.
- Helps to make production and production chain-related decisions.
Break Even Analysis Formula Calculator
You can use the following Break Even Analysis Calculator.
| Fixed Cost | |
| Contribution Margin Per Unit | |
| Break Even Points in Units Formula | |
| Break Even Points in Units Formula | = |
|
|
Conclusion – Break Even Analysis Formula
Break Even Analysis formula helps to increase profitability by reducing the number of unit of product which needs to be produced using the Beak Even point formula. It helps to set a target for sales and to generate revenue. But, these models reflect non-cash expenses like depreciation; to get the exact Break-Even point, non-cash expenses must be subtracted.
Recommended Articles
This has been a guide to the Break Even Analysis formula. Here we discuss How to Calculate Break Even Analysis along with practical examples. We also provide Break Even Analysis Calculator with a downloadable Excel template. You may also look at the following articles to learn more –
