Updated June 7, 2023
Excel Quick Analysis (Table of Contents)
Overview of Excel Quick Analysis
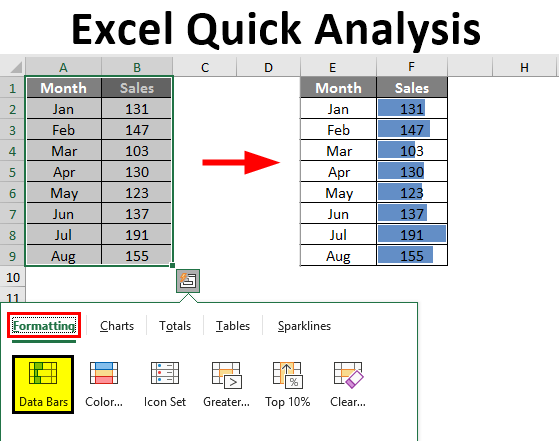
Excel is tremendous while doing data analysis; for this purpose, only excel has various kinds of formulas, tools, visualization charts, and many other kinds of stuff. Over a period of time, Microsoft has made handy updates with its new version of products, and similarly, in its 2013 version of excel, it has provided one more useful tool, i.e. “Quick Analysis”.
You must have searched for this tool in Excel 2013, but it is always with you whenever you select the data. Yes, it is with you, but you are not interested in that at all, so in this article, we have decided to take you through the “Quick Analysis” option with Excel.
What are Quick Analysis Tools in Excel?
When analyzing the data, instead of going through various tabs, we can use the Quick Analysis tool to insert charts, visualizations, various formatting techniques, formulas, tables, pivot tables, and Sparklines.
These can be done in a few seconds.
How to Use Quick Analysis Tools in Excel?
Here are some following ways to Operate Quick Analysis Tools in Excel.
Where are Quick Analysis Tools in Excel?
Now the important question is where this tool is. This tool appears when we select the data range in Excel. For an example, look at the below data.
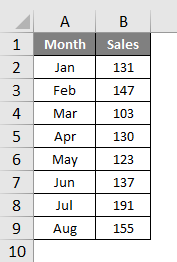
Once we select the data, we can see a small icon at the bottom right of the selection.
![]()
I know you have seen this icon before but have not worried about this. Unfortunately, not many Excel users make use of this wonderful tool. We will show the various kinds of analysis tools it has.
Quickly Insert Formatting into the Data
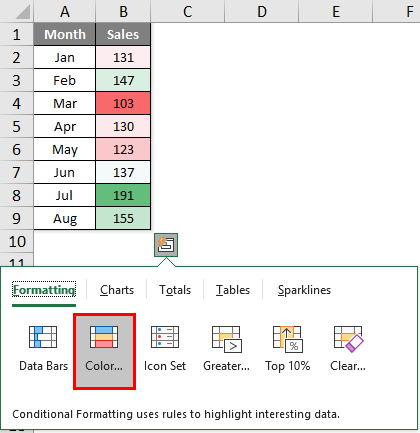
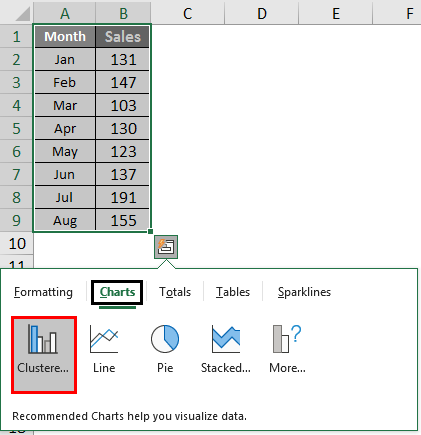
Once you select the data, we can see the Quick Analysis tool icon at the bottom of the selection. Click on this icon to explore all the possible options.
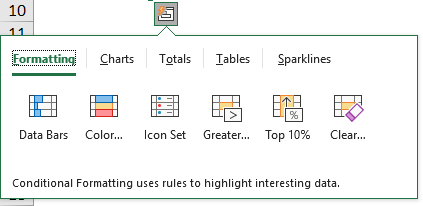
We have “Formatting, Charts, Totals, Tables, and Sparkline’s”.
Let’s look at formatting now. Just place a cursor on the required formatting option we can see the immediate impact on our data.
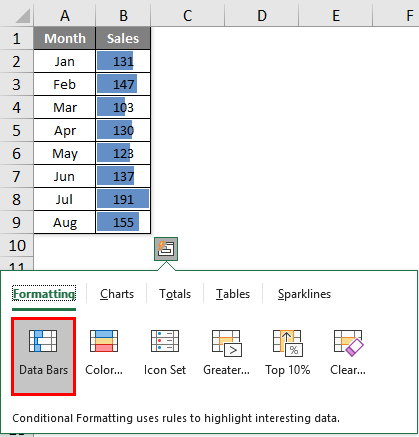
I have placed a cursor on “Data Bars” It has inserted data bars according to the size of the numbers. Similarly, we can use “Color Set, Icon Set, Greater Than, Top Value, and, more importantly, clear the formatting with the “Clear” option.
Click on the Color set to insert different colors.
Click on Icon Set to get icons for your numbers.
![]()
If you want to highlight all the values greater than 140, click on the Greater option below the window.
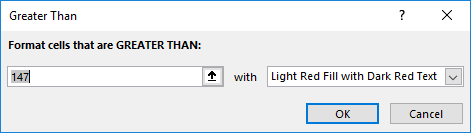
Mention the value as 140 and choose the formatting color.
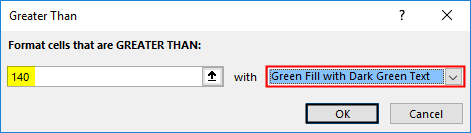
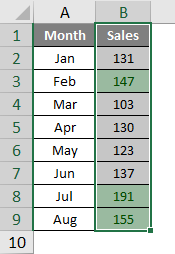
Click on OK; we will have mentioned formatting for all the values which are >140.
Quickly Analysis Inserting Chart into the Data
We can also insert a chart to the selected data using the Quick Analysis tool. Once the data is selected, click on “CHARTS”.
Select the required chart; your quick analysis is ready to use.
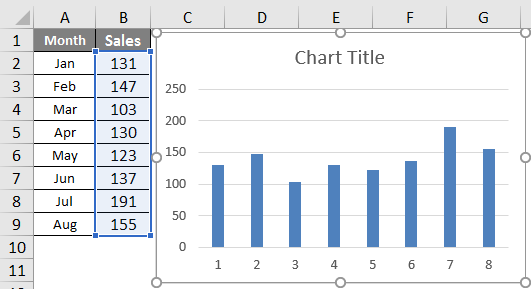
Like this, we can use various charts that suit our data structure.
Quickly Analysis through Totals
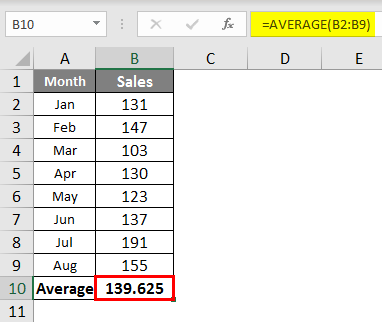
We can also insert totals to the data by choosing TOTALS under quick analysis. Under this, we have a various variety of formulas.
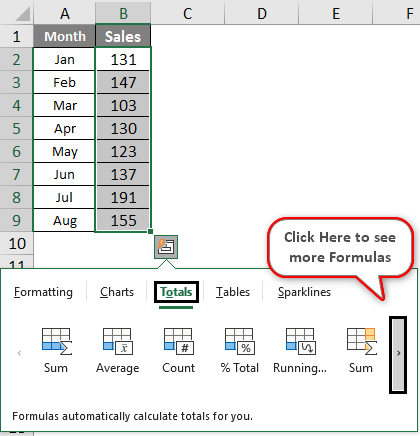
We can insert SUM, AVERAGE, COUNT, % Total, Running Total, SUM to the Right, Average to the Right, count to the right, and running total to the right.
Based on the requirement, we can make use of these formulas. Now I have applied RUNNING TOTAL.
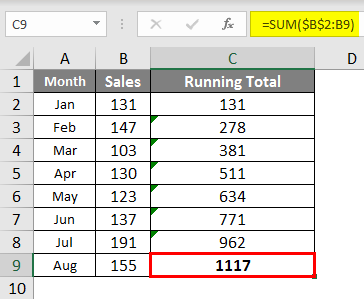
Similarly, you can use SUM, AVERAGE, etc.
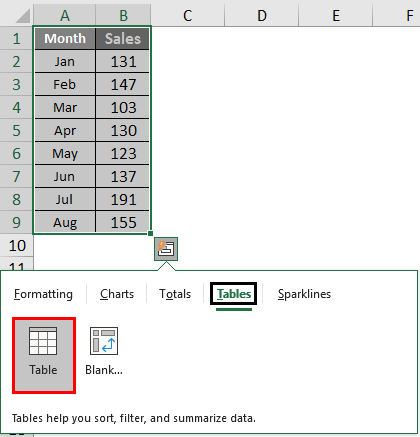
Quickly Analysis through Tables
We can also insert the table format and pivot the table to the data under Tables. Click on TABLES and choose the option you want to use.
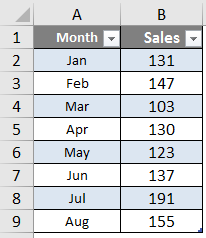
The table will convert the range of data to table format data.
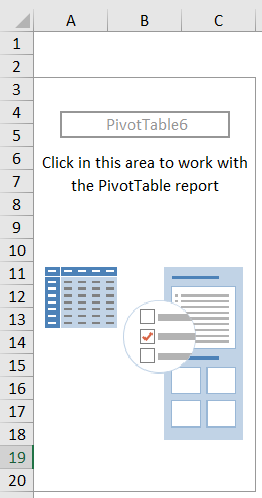
If you click on Pivot Table, it will insert the pivot table in a new sheet.
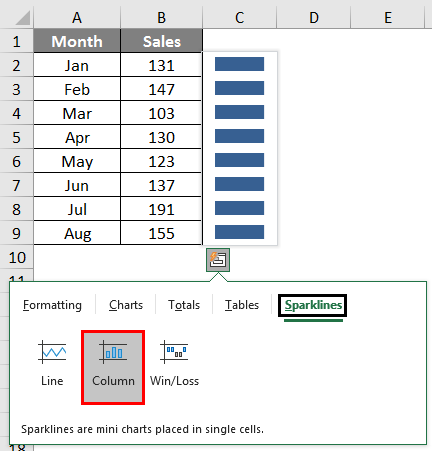
Quickly Analysis through Sparkline’s
We can insert Sparklines to the right of the data under the SPARKLINES option.
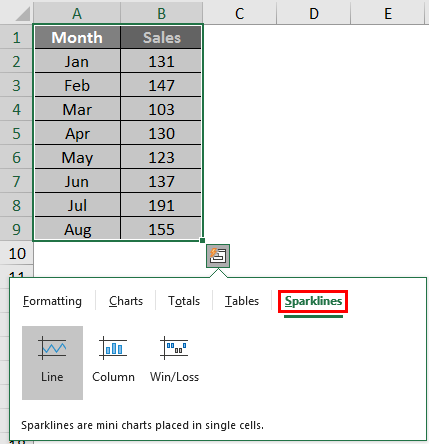
Based on our selection, it will display the Sparkline to the left of the data.
Like, by using the “Quick Analysis” tool, we can quickly analyze our data without breaking any sweat.
Recommended Articles
This is a guide to Excel Quick Analysis. Here we discuss how to make use of the Quick Analysis tool to insert charts, visualizations, various formatting techniques, formulas, tables, pivot tables, and Sparklines, along with a downloadable Excel template. You may also look at the following articles to learn more –
