Updated June 28, 2023
Excel Tool for Data Analysis (Table of Contents)
- Data Analysis Tool in Excel
- Unleash Data Analysis Tool Pack in Excel
- How to Use the Data Analysis Tool in Excel?
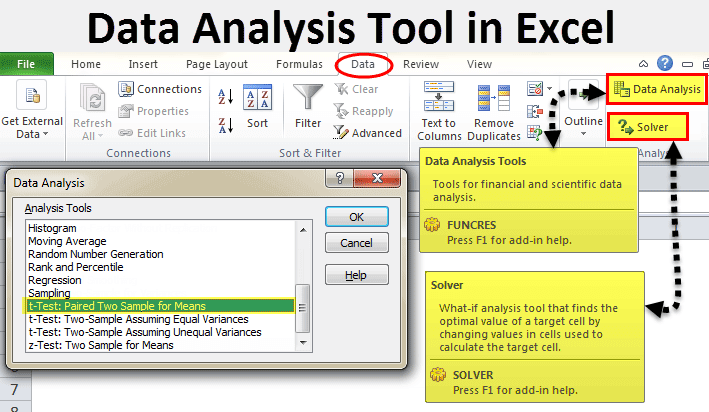
Data Analysis Tool in Excel
In Excel, we have a few built-in tools used for Data Analysis. But these become active only when you select any of them. To enable the Data Analysis tool in Excel, go to the File menu’s Options tab. Once we get the Excel Options window from Add-Ins, select any of the analysis packs, let’s say Analysis Toolpak, and click on Go. This will take us to the window from where we can select one or multiple Data analysis tool packs, which can be seen in the Data menu tab.
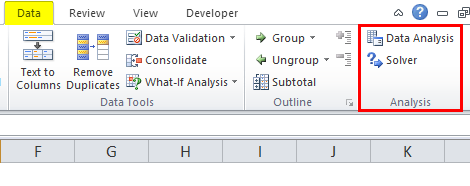
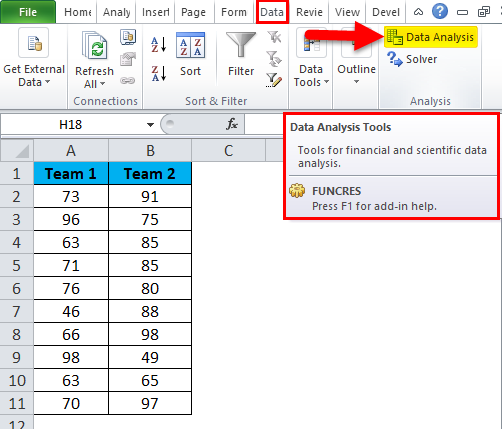
If you observe Excel on your laptop or computer, you may not see the data analysis option by default. You need to unleash it. Usually, a data analysis tool pack is available under the Data tab.
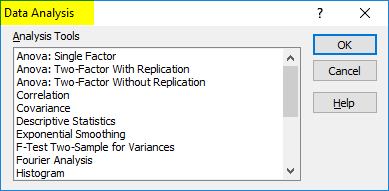
Under the Data Analysis option, we can see many analysis options.
Unleash Data Analysis Tool Pack in Excel
If your Excel is not showing this pack, follow the below steps to unleash this option.
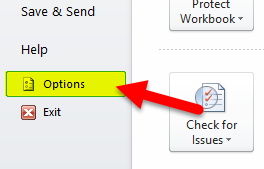
Step 1: Go to FILE.
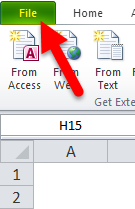
Step 2: Under File, select Options.
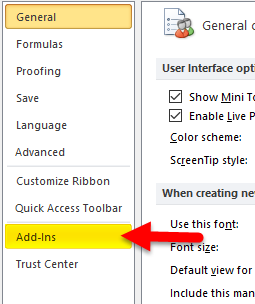
Step 3: After selecting Options, select Add-Ins.
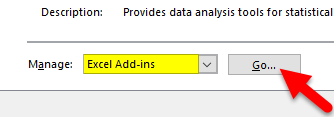
Step 4: Once you click Add-Ins at the bottom, you will see the Manage drop-down list. Select Excel Add-ins and click on Go.
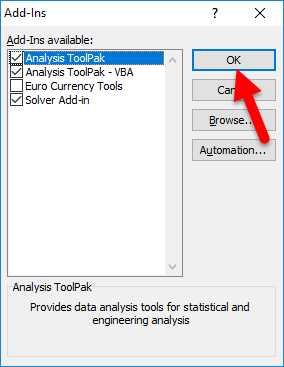
Step 5: You will see a new dialogue box once you click Go. You will see all the available Analysis Tool Packs. I selected 3 of them and then clicked on Ok.
Step 6: You will see these options under the Data ribbon.

How to Use the Data Analysis Tool in Excel?
Let’s understand the working of a data analysis tool with some examples.
T-test Analysis – Example #1
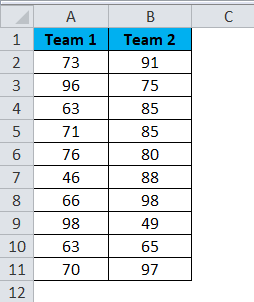
A t-test is returning the probability of the tests. Look at the below data of two teams scoring patterns in the tournament.
Step 1: Select the Data Analysis option under the DATA tab.
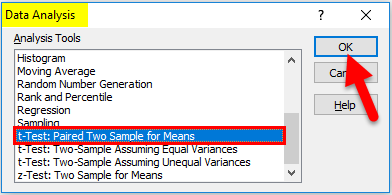
Step 2: Once you click on Data Analysis, you will see a new dialogue box. Scroll down and find the T-test. Under T-test, you will have three kinds of T-test; select the first one, i.e., t-Test: Paired Two Sample for Means.
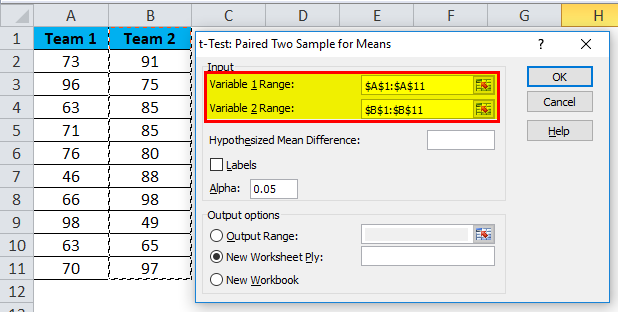
Step 3: After selecting the first t-Test, you will see the below options.
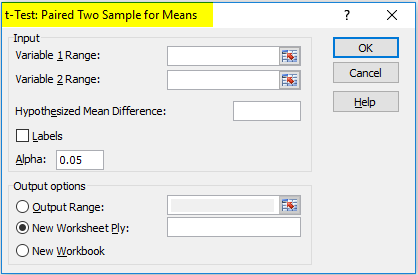
Step 4: Under Variable 1 Range, select Team 1 score; under Variable 2 Range, select Team 2 score.
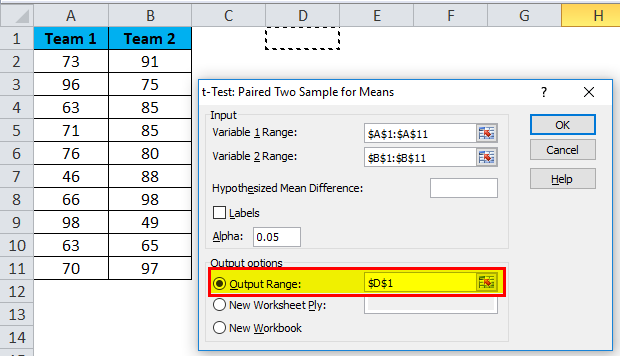
Step 5: Output Range selects the cell where you want to display the results.
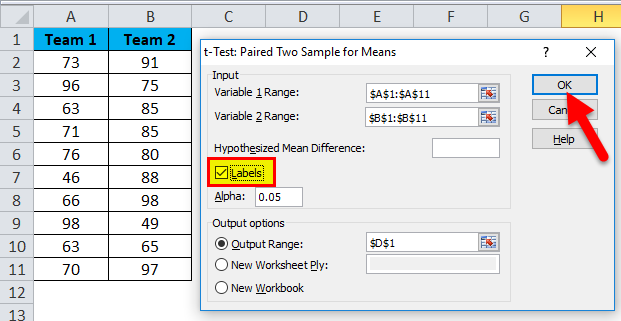
Step 6: Click on Labels because we have selected the ranges, including headings. Click on Ok to finish the test.
Step 7: From the D1 cell, it will start showing the test result.
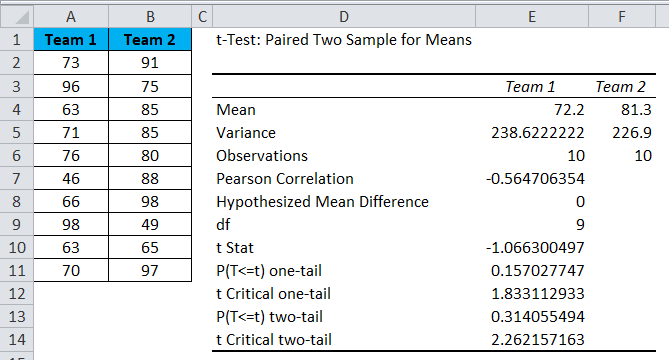
The result will show the mean value of the two teams, Variance Value, how many observations are conducted or how many values are taken into consideration, Pearson Correlation, etc………
If you P (T<=t) two-tail, it is 0.314, higher than the standard expected P-value of 0.05. This means data is not significant.
We can also do the T-test by using the built-in function T.TEST.
SOLVER Option – Example#2
A solver is nothing but solving the problem. SOLVER works like a goal seek in Excel.
Look at the below image. I have data on product units, unit price, total cost, and total profit.
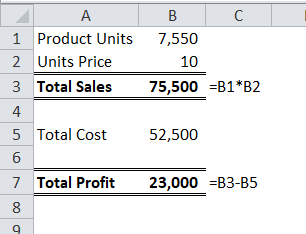
Units sold quantity is 7550 at a selling price of 10 per unit. The total cost is 52500, and the total profit is 23000.
As a proprietor, I want to earn a profit of 30000 by increasing the unit price. As of now, I don’t know how much unit price I have to increase. SOLVER will help me to solve this problem.
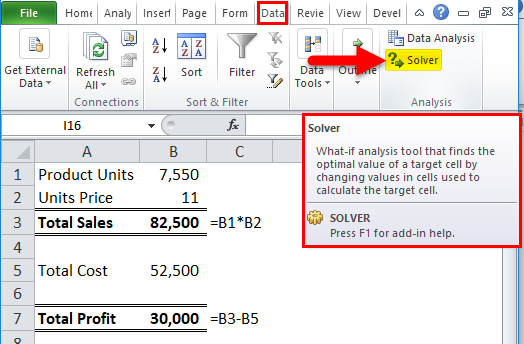
Step 1: Open SOLVER under the DATA tab.
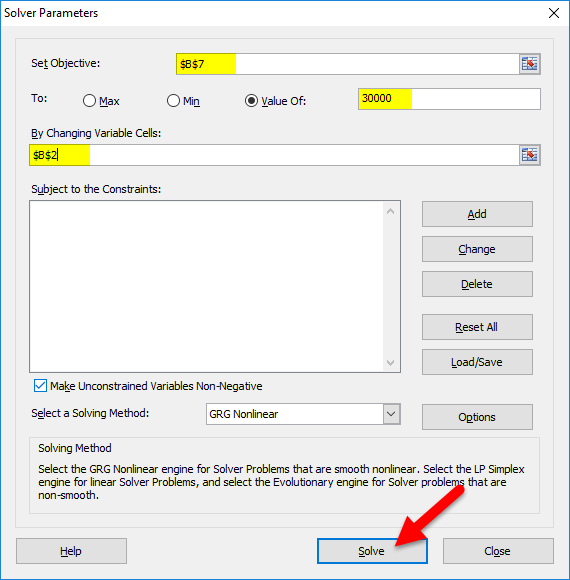
Step 2: Set the objective cell as B7 and the value of 30000 by changing the cell to B2. Since I don’t have any other special criteria to test, I am clicking on the SOLVE button.
Step 3: The Result will be as below:
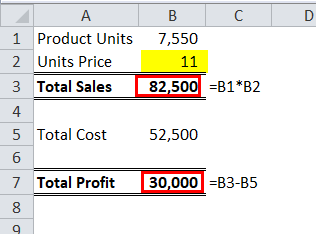
Ok, excel SOLVER solved the problem for me. To make a profit of 30000, I need to sell the products at 11 per unit instead of 10 per unit.
In this way, we can analyze the data.
Things to Remember
- We have many other analysis tests like Regression, F-test, ANOVA, Correlation, and Descriptive techniques.
- We can add Excel Add-in as a data analysis tool pack.
- The analysis tool pack is available under VBA too.
Recommended Articles
This has been a guide to Data Analysis Tools in Excel. We discuss using the Excel Data Analysis Tool, Excel examples, and a downloadable Excel template here. You may also look at these useful articles in Excel –
