EDUCBA

EDUCBA

MENUMENU
  • Free Tutorials
  • Certification Courses
  • 120+ Courses All in One Bundle
  • Login
Home Excel Excel Resources Excel Tools Excel Regression Analysis
Secondary Sidebar
Excel Functions
  • Excel Tools
    • Excel Shortcut Redo
    • Reduce Excel File Size
    • Quick Analysis in Excel
    • Goal Seek in Excel
    • Compare Two Lists in Excel
    • Excel Quick Analysis
    • Estimate Template in Excel
    • Pivot Table Count Unique
    • CSV Files into Excel
    • Excel Business Plan Template
    • Excel Export to PDF
    • Free Excel Template
    • Excel Repair
    • Color in Excel
    • Form Controls in Excel
    • Timecard Template in Excel
    • How to Unhide All Sheets in Excel?
    • Power Query in Excel
    • Power View in Excel
    • XML in Excel
    • Excel Evaluate Formula
    • Examples of Excel Macros
    • Consolidation in Excel
    • Ribbon in Excel
    • Excel Conditional Formatting for Dates
    • Protect Sheet in Excel
    • Data Model in Excel
    • Pivot Table Examples
    • Pivot Table Slicer
    • Pivot Table Filter
    • Watch Window in Excel
    • Slicer in Excel
    • Print Gridlines in Excel
    • Convert Numbers to Text in Excel
    • Freeze Columns in Excel
    • Spelling Check in Excel
    • Name Box in Excel
    • Solve Equation in Excel
    • Excel Spreadsheet Examples
    • What If Analysis in Excel
    • How to Print Labels From Excel
    • Excel Named Range
    • Excel TRANSPOSE Formula
    • Excel Merge and Center
    • Excel Freeze Rows
    • HLOOKUP Formula in Excel
    • Excel Create Database
    • Excel Gridlines
    • Excel Spreadsheet Formulas
    • Excel Sort By Number
    • Excel Concatenating Columns
    • Excel AutoCorrect
    • Conditional Formatting For Blank Cells
    • Excel Icon Sets
    • Excel CTRL D
    • Excel Accounting Number Format
    • Excel Regression Analysis
    • Excel Import Data
    • Excel Freeze Panes
    • Excel Calendar
    • Excel Developer Tab
    • Excel Enable Macros
    • Excel Autosave
    • Heat Map in Excel
    • Excel Toolbar
    • Excel Error Bar
    • Excel Status Bar
    • Excel Unprotect Sheet
    • Check mark in Excel
    • Excel Column Filter
    • Excel Header and Footer
    • Excel Drawing
    • Range in Excel
    • Timeline in Excel
    • Excel Lock Formula
    • Excel Table styles
    • Insert New Worksheet in Excel
    • Excel Column Lock
    • Excel Forms for Data Entry
    • QUOTIENT in Excel
    • Excel Sorting
    • Excel Sort by color
    • Excel Data Bars
    • Excel Tool for Data Analysis
    • Excel Flash Fill
    • Excel Auto Fill
    • Excel Quick Access Toolbar
    • Excel Wrap Text
    • Excel Exponential Smoothing
    • Excel ANOVA
    • Excel Merge Two Tables
    • Excel Conditional Formatting in Pivot Table
    • Dynamic Tables in Excel
    • Excel Sort by date
    • Excel Dynamic Range
    • Record Macro in Excel
    • Two Variable Data Table in Excel
    • Merge Cells in Excel
    • One Variable Data Table in Excel
    • Excel Fill Handle
    • CheckBox in Excel
    • Excel Table
    • Excel Combo Box
    • Auto Format in Excel
    • Advanced Filter in Excel
    • Excel AutoFilter
    • Excel Data Filter
    • Excel Data Validation
    • Excel Radio Button
    • Data Table in Excel
    • Text to Columns in Excel
    • Excel List box
    • Excel Solver Tool
    • Scrollbar in Excel
  • Excel Functions (12+)
  • Financial Functions in Excel (17+)
  • Logical Functions in Excel (14+)
  • Lookup Reference Functions in Excel (35+)
  • Maths Function in Excel (47+)
  • TEXT and String Functions in Excel (26+)
  • Date and Time Function in Excel (24+)
  • Statistical Functions in Excel (59+)
  • Information Functions in Excel (4+)
  • Excel Charts (56+)
  • Excel Tips (222+)
  • Workplace Productivity (4+)
  • Microsoft Office Tools (15+)
  • Excel Formula and Functions (22+)
  • MS Excel Shortcuts (4+)
Excel Functions Courses
  • EXCEL ADVANCED Training
  • EXCEL Training COURSE

Excel Regression Analysis

By Madhuri ThakurMadhuri Thakur

Regression Analysis in Excel

Excel Regression Analysis (Table of Contents)

  • Regression Analysis in Excel
  • Explanation of Regression Mathematically
  • How to Perform Linear Regression in Excel?
    • #1 – Regression Tool Using Analysis ToolPak in Excel
    • #2 – Regression Analysis Using Scatterplot with Trendline in Excel

Regression Analysis in Excel

Linear regression is a statistical technique that examines the linear relationship between a dependent variable and one or more independent variables.

Start Your Free Excel Course

Excel functions, formula, charts, formatting creating excel dashboard & others

All in One Excel VBA Bundle(120+ Courses, 30+ Projects)
Basic ExcelAdvanced ExcelVBA & MacrosExcel Dashboards
Pivot TablesStatistical FunctionsFinancial FunctionsCharts & Graphs
Price
View Courses
120+ Online Courses | 30+ Projects | 500+ Hours | Verifiable Certificates | Lifetime Access
4.9 (64,325 ratings)
  • Dependent Variable (aka response/outcome variable): This is the variable of your interest and wanted to predict based on the Independent variable(s).
  • Independent Variable (aka explanatory/predictor variable): Is/are the variable(s) on which response variable is depend. This means these are the variables using which response variables can be predicted.

Linear relationship means the change in an independent variable(s) causes a change in the dependent variable.

There are basically two types of linear relationships as well.

  1. Positive Linear Relationship: When the independent variable increases, the dependent variable increases too.
  2. Negative Linear Relationship: When the independent variable increases, the dependent variable decreases.

These were some of the pre-requisites before you actually proceed towards regression analysis in excel.

There are two basic ways to perform linear regression in excel using:

  • Regression tool through Analysis ToolPak
  • Scatter chart with a trendline

There is actually one more method which is using manual formula’s to calculate linear regression. But why should you go for it when excel does calculations for you?

Therefore, we are going to talk about the two methods discussed above only.

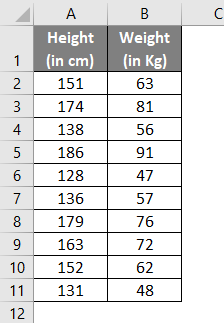
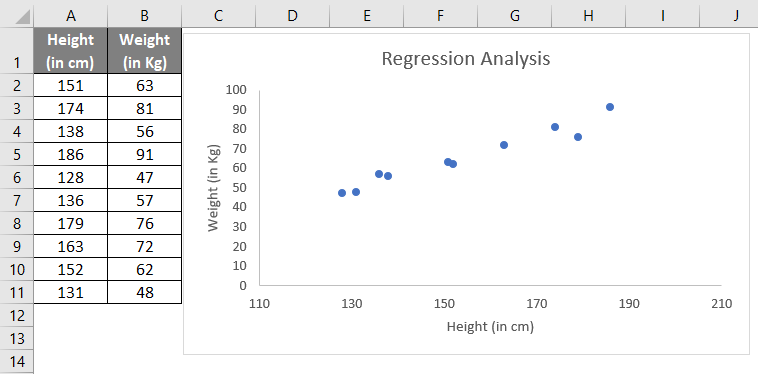
Suppose you have data on the height and weight of 10 individuals. If you plot this information through a chart, let’s see what it gives.

Linear Regression

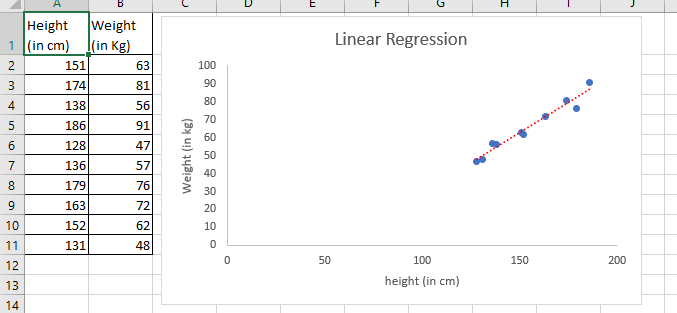
As the above screenshot shows, the linear relationship can be found in Height and Weight through the graph. Don’t get much involved in graphs now; we are anyhow going to dig it deep in the second portion of this article.

Explanation of Regression Mathematically

We have a mathematical expression for linear regression as below:

Y = aX + b + ε

Where,

  • Y is a dependent variable or response variable.
  • X is an independent variable or predictor.
  • a is the slope of the regression line. This represents that when X changes, there is a change in Y by “a” units.
  • b is intercepting. It is the value Y takes when the value of X is zero.
  • ε is the random error term. It occurs because Y’s predicted value will never be exactly the same as the actual value for a given X. We don’t need to worry about this error term as some software do the calculation of this error term in the backend for you. Excel is one of that software.

In that case, the equation becomes,

Y = aX + b

Which can be represented as:

Weight = a*Height + b

We’ll try to find out the values of these a and b using methods we have discussed above.

How to Perform Linear Regression in Excel?

The further article explains the basics of regression analysis in excel and shows a few different ways to do linear regression in Excel.

You can download this Regression Analysis Excel Template here – Regression Analysis Excel Template

#1 – Regression Tool Using Analysis ToolPak in Excel

For our example, we’ll try to fit regression for Weight values (which is a dependent variable) with the help of Height values (which is an independent variable).

Independent Variables

  • In the excel spreadsheet, click on Data Analysis (present under Analysis Group) under Data.

Data Analysis

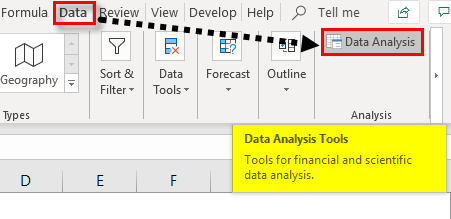
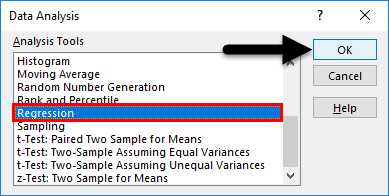
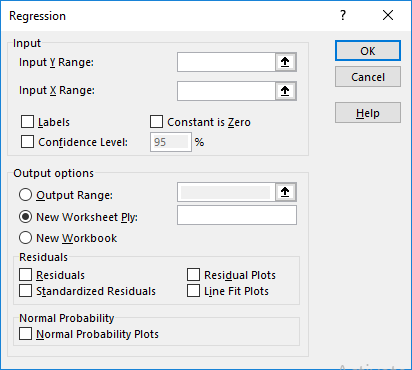
  • Search out for Regression. Could you select it and press, ok?

Regression option

  • Use the following inputs under the Regression pane, which opens up.

Inputs under Regression

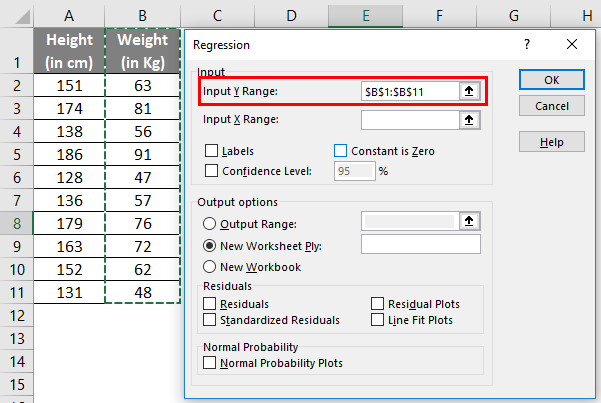
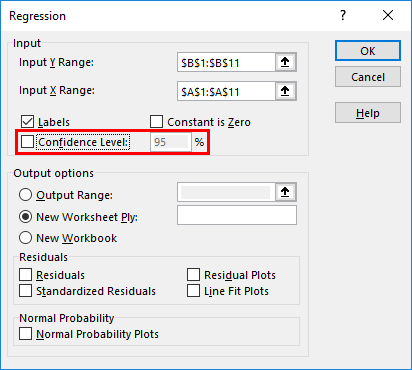
  • Input Y Range: Select the cells which contain your dependent variable (in this example, B1:B11)

Inputing Y Range

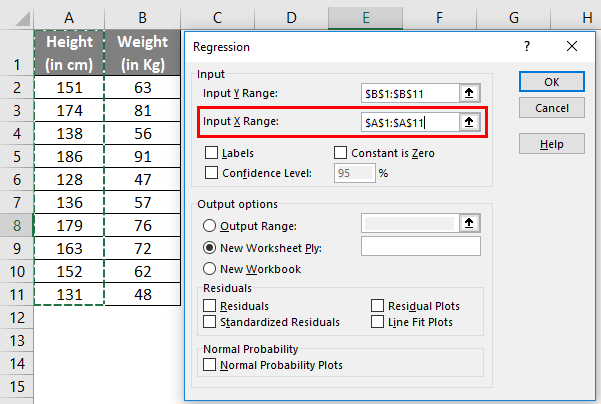
  • Input X Range: Select the cells which contain your independent variable (in this example, A1:A11).

Input X Range

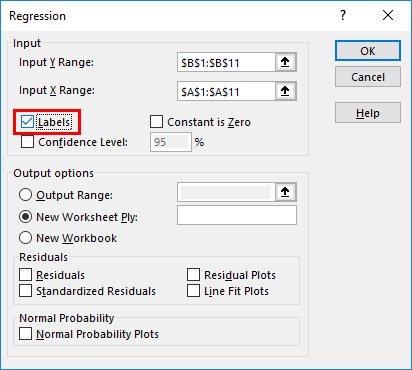
  • Check the box named Labels if your data have column names (in this example, we have column names).

Labels

  • The confidence level is set to 95% by default, which can be changed as per users requirements.

Confidence Level

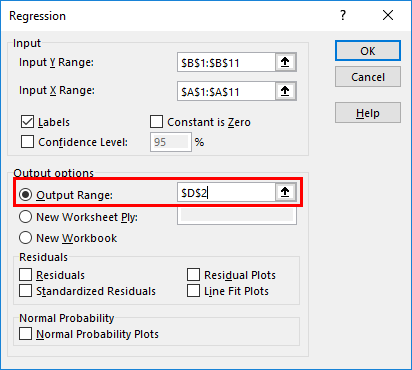
  • Under Output options, you can customize where you want to see the regression analysis output in Excel. In this case, we want to see the output on the same sheet. Therefore, given range accordingly.

Output Range

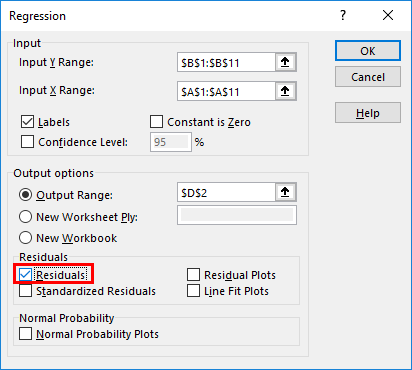
  • Under the Residuals option, you have optional inputs like Residuals, Residual Plots, Standardized Residuals, Line Fit Plots which you can select as per your need. In this case, check the Residuals checkbox so that we can see the dispersion between predicted and actual values.

Residuals

  • Under the Normal Probability option, you can select Normal Probability Plots, which can help you check the normality of predictors. Click on OK.

Regression Analysis Step 1-10

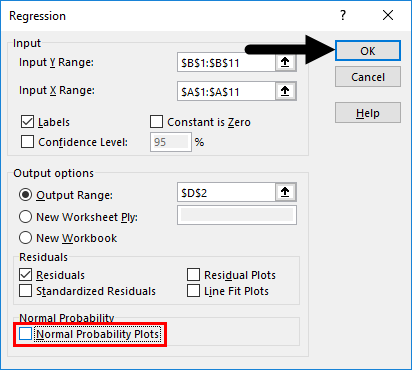
  • Excel will compute Regression analysis for you in a fraction of seconds.

Regression Analysis Step 1-11

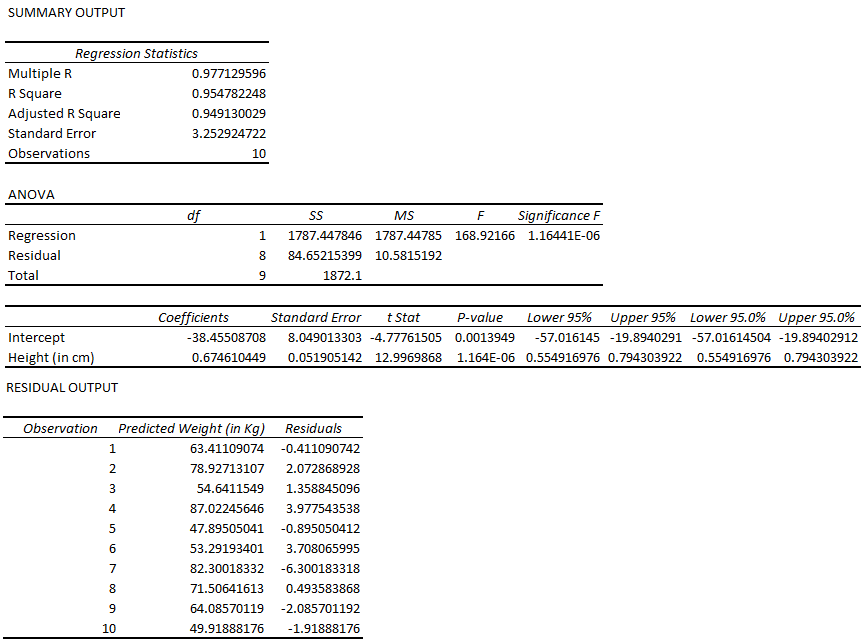
Till here, it was easy and not that logical. However, interpreting this output and make valuable insights from it is a tricky task.

One important part of this entire output is R Square/ Adjusted R Square under the SUMMARY OUTPUT table, which provides information, how good our model is fit. In this case, the R Square value is 0.9547, which interprets that the model has a 95.47% accuracy (good fit). Or in another language, information about the Y variable is explained 95.47% by the X variable.

Regression Analysis Step 1-12

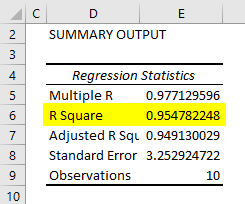
The other important part of the entire output is a table of coefficients. It gives values of coefficients that can be used to build the model for future predictions.

Regression Analysis Step 1-13

Now our, regression equation for prediction becomes:

Weight = 0.6746*Height – 38.45508 (Slope value for Height is 0.6746… and Intercept is -38.45508…)

Did you get what you have defined? You have defined a function in which you now just have to put the value of Height, and you’ll get the Weight value.

#2 – Regression Analysis Using Scatterplot with Trendline in Excel

Now, we’ll see how in excel, we can fit a regression equation on a scatterplot itself.
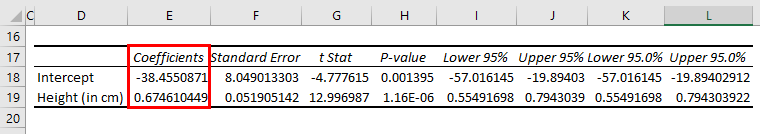
  • Select your entire two columned data (including headers).
  • Click on Insert and select Scatter Plot under the graphs section as shown in the image below.

Regression Analysis Step 2-1

  • See the output graph.

Regression Analysis Step 2-2

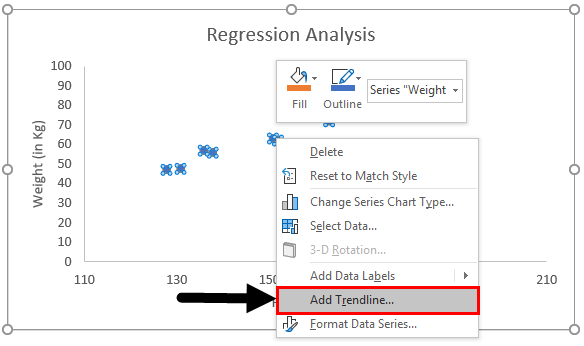
  • Now, we need to have the least squared regression line on this graph. To add this line, right-click on any of the graph’s data points and select Add Trendline option.

Regression Analysis Step 2-3

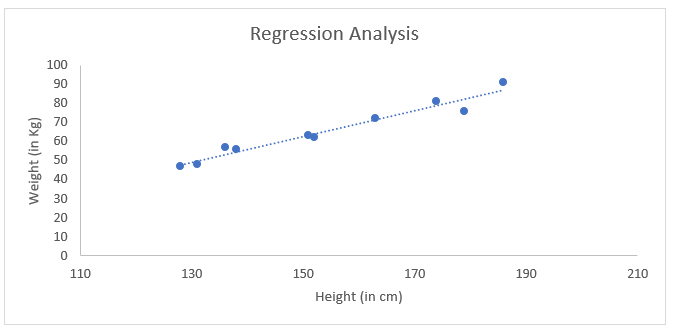
  • It will enable you to have a trendline of the least square of regression like below.

Regression Analysis Step 2-4

  • Under the Format Trendline option, check the box for Display Equation on Chart.

Regression Analysis Step 2-5

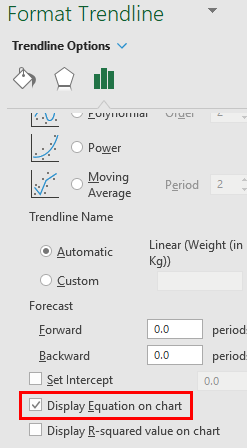
  • It enables you to see the equation of the least squared regression line on the graph.

Regression Analysis Step 2-6

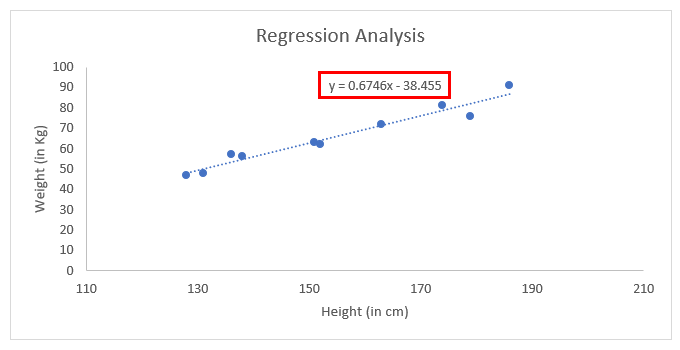
This is the equation using which we can predict the weight values for any given set of Height values.

Things to Remember About Regression Analysis in Excel

  • You can change the layout of the trendline under the Format Trendline option in the scatter plot.
  • It is always recommended to have a look at residual plots while you are doing regression analysis using Data Analysis ToolPak in Excel. It gives you a better understanding of the spread of the actual Y values and estimated X values.
  • Simple Linear Regression in excel does not need ANOVA and Adjusted R Square to check. These features can be considered for Multiple Linear Regression, which is beyond the scope of this article.

Recommended Articles

This has been a guide to Regression Analysis in Excel. Here we discuss how to do Regression Analysis in Excel along with excel examples and a downloadable excel template. You can also go through our other suggested articles –

  1. Excel Tool for Data Analysis
  2. Calculate ANOVA in Excel
  3. How to find Excel Moving Averages
  4. Z TEST Examples in Excel
Popular Course in this category
Excel Advanced Training (16 Courses, 23+ Projects)
  16 Online Courses |  23 Hands-on Projects |  140+ Hours |  Verifiable Certificate of Completion
4.8
Price

View Course

Related Courses

Excel Training (23 Courses, 9+ Projects)4.9
0 Shares
Share
Tweet
Share
Primary Sidebar
Footer
About Us
  • Blog
  • Who is EDUCBA?
  • Sign Up
  • Live Classes
  • Corporate Training
  • Certificate from Top Institutions
  • Contact Us
  • Verifiable Certificate
  • Reviews
  • Terms and Conditions
  • Privacy Policy
  •  
Apps
  • iPhone & iPad
  • Android
Resources
  • Free Courses
  • Excel Charts
  • Excel Tips
  • All Tutorials
Certification Courses
  • All Courses
  • Excel VBA Course - All in One Bundle
  • VBA Course
  • Excel Data Analysis Course
  • Excel for Marketing Course
  • Excel for Finance Course
  • Excel for HR Training

ISO 10004:2018 & ISO 9001:2015 Certified

© 2022 - EDUCBA. ALL RIGHTS RESERVED. THE CERTIFICATION NAMES ARE THE TRADEMARKS OF THEIR RESPECTIVE OWNERS.

EDUCBA
Free Excel Course

Excel functions, formula, charts, formatting creating excel dashboard & others

*Please provide your correct email id. Login details for this Free course will be emailed to you

By signing up, you agree to our Terms of Use and Privacy Policy.

EDUCBA Login

Forgot Password?

By signing up, you agree to our Terms of Use and Privacy Policy.

EDUCBA
Free Excel Course

Excel functions, formula, charts, formatting creating excel dashboard & others

*Please provide your correct email id. Login details for this Free course will be emailed to you

By signing up, you agree to our Terms of Use and Privacy Policy.

EDUCBA

*Please provide your correct email id. Login details for this Free course will be emailed to you

By signing up, you agree to our Terms of Use and Privacy Policy.

Let’s Get Started

By signing up, you agree to our Terms of Use and Privacy Policy.

EDUCBA

Download Regression Analysis Excel Template

EDUCBA

Download Regression Analysis Excel Template

EDUCBA

डाउनलोड Regression Analysis Excel Template

This website or its third-party tools use cookies, which are necessary to its functioning and required to achieve the purposes illustrated in the cookie policy. By closing this banner, scrolling this page, clicking a link or continuing to browse otherwise, you agree to our Privacy Policy

Loading . . .
Quiz
Question:

Answer:

Quiz Result
Total QuestionsCorrect AnswersWrong AnswersPercentage

Explore 1000+ varieties of Mock tests View more