Updated July 4, 2023
Z TEST in Excel
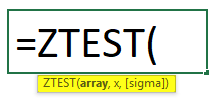
With the help of the Z-Test, we compare the means of two datasets in Excel that are equal or not. In Excel, we have a function for Z-Test named as ZTest, where, as per syntax, we need to have Array and X value (Hypothesized sample mean) and Sigma value (Optional). Mostly X is a minimum of 95% probability, which can take from 0 to 5. Another way of doing Z-Test is from the Data Analysis option from the Data menu tab. There we would need 2 variable ranges, 2 variances of each range. If Z < Z Critical then we will reject the null hypothesis.
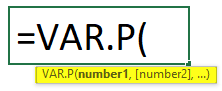
Z TEST Formula in Excel
Below is the Z TEST Formula:
Z TEST Formula has the below arguments:
- Array: Test the hypothesized sample mean for the given set of values.
- X: The hypothesized sample mean, which requires a test.
- Sigma: This is an optional argument that represents the population standard deviation. If it’s not given or unknown, use the sample standard deviation.
How to Use the Z Test Function in Excel?
There are two ways to use Z TEST in Excel, which are:
- One sample Z TEST
- Two sample Z TEST
Here we will cover both ways one by one in detail.
One sample Z TEST:
If we have given one dataset, we use the Z TEST function, which falls under the statistical functions category. This Z TEST function in Excel gives the one-tailed probability value of a test.
Z TEST function:
This function gives you the probability that the supplied hypothesized sample mean is greater than the mean of the supplied data values.
Z TEST Function is very simple and easy to use.
Working of Z TEST Function in Excel with Examples
Let’s understand the working of the Z TEST Function in Excel with some examples.
Example #1
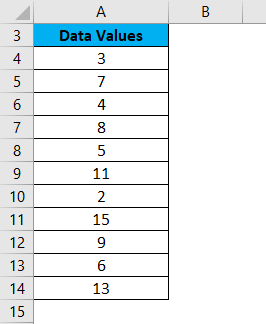
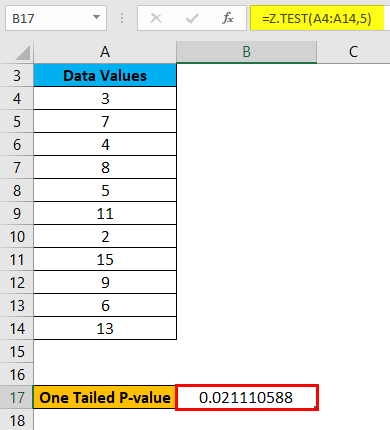
We have given the below set of values:
To calculate the one-tailed probability value of a Z Test for the above data, let’s assume the hypothesized population mean is 5. Now we will use the Z TEST formula as shown below:
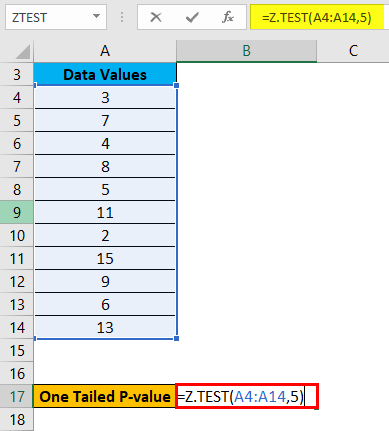
The result is given below:
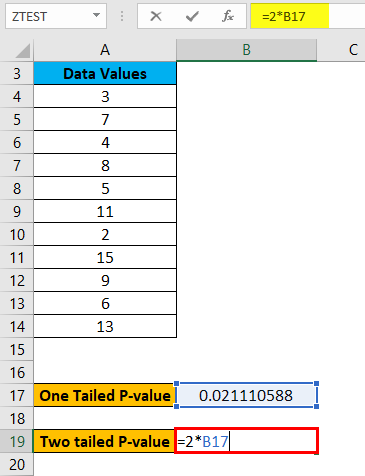
Using the above result, we can also calculate the two-tailed probability of a Z TEST.
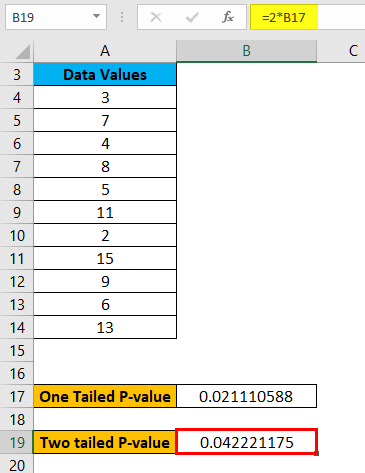
The formula below calculates the two-tailed P-value of a Z TEST for the given hypothesized population, which is 5.
The result is given below:
Two Sample Z Test:
While using the Z Test, we test a null hypothesis that states that the two population’s mean is equal.
i.e.
H0: µ1 – µ 2 = 0
H1: µ1 – µ 2 ≠ 0
Where H1 is called an alternative hypothesis, the mean of the two populations is not equal.
Let’s take an example to understand the usage of two sample Z tests.
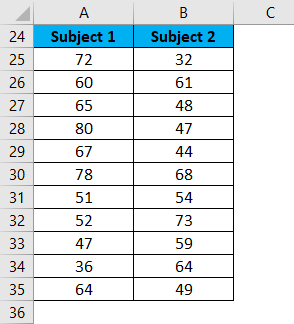
Example #2
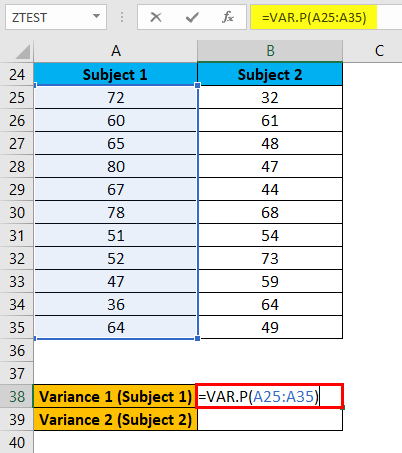
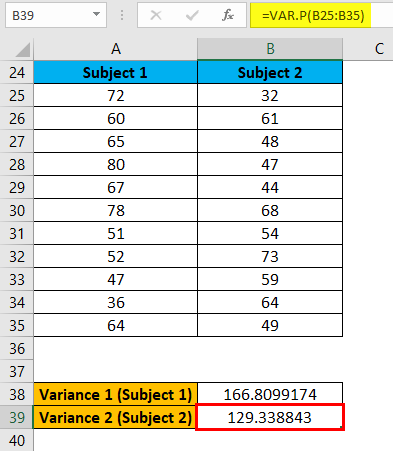
Let’s take the example of student’s marks in two different subjects.
Now we need to calculate the variance of both subjects, so we will use the below formula for this:
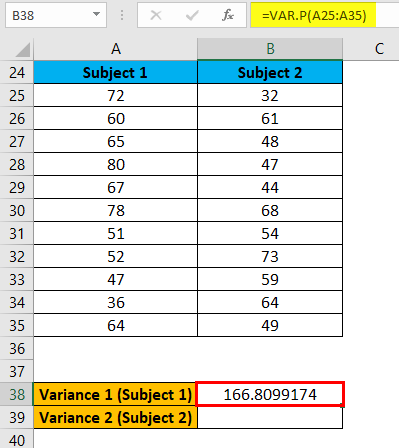
The above formula applies for Variance 1 (Subject 1) like below:
The result is given below:
The above same formula applies for Variance 2 (Subject 2) like below:
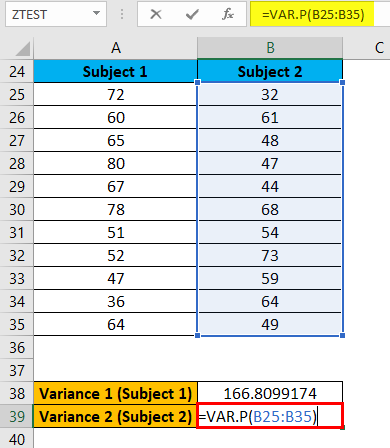
The result is given below:
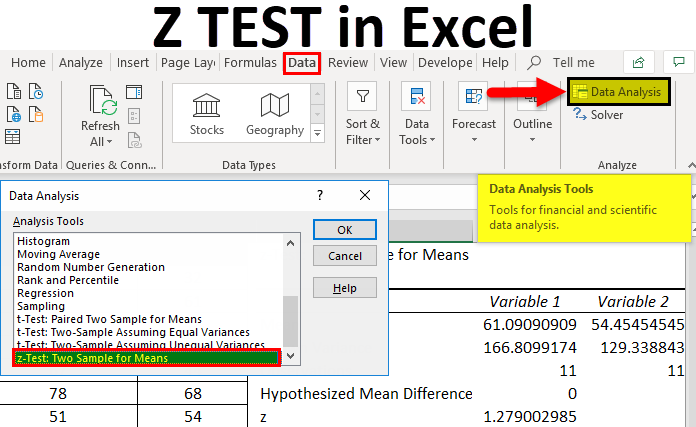
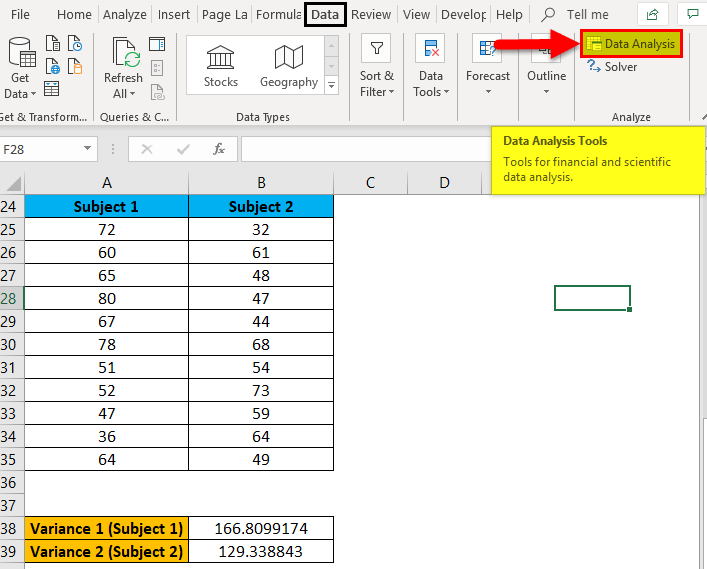
- Now, Go to the Data Analysis tab in the extreme upper right corner under the DATA tab as shown below screenshot:
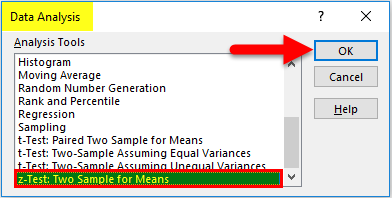
- It will open a dialog box with Data Analysis options.
- Click on z-Test: Two-Sample for Means and click on OK, as shown below.
- It will open a dialog box for Z-test, as shown below.
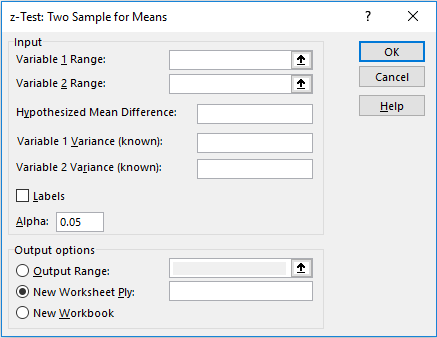
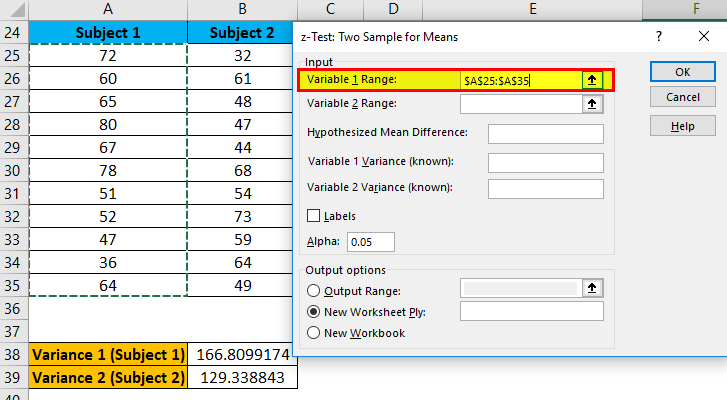
- Now in the Variable 1 range box, select subject 1 range from A25:A35
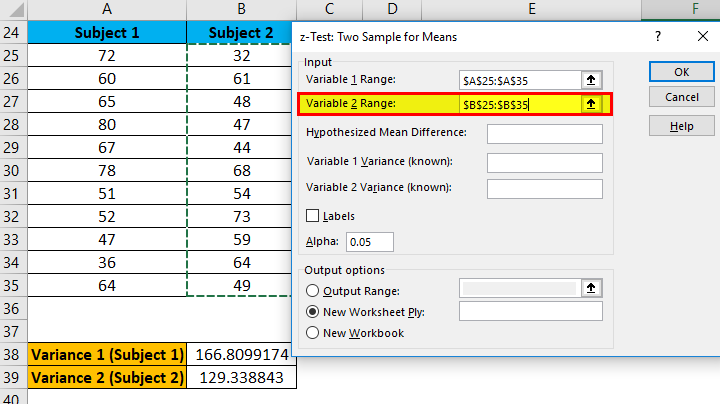
- Similarly, in the Variable 2 range box, select subject 2 range from B25:B35
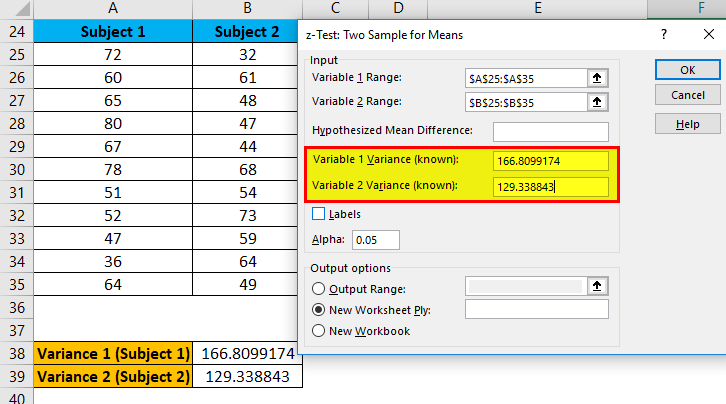
- Under the Variable 1 variance box, enter cell B38 variance value.
- Under the Variable 2 variance box, enter cell B39 variance value.
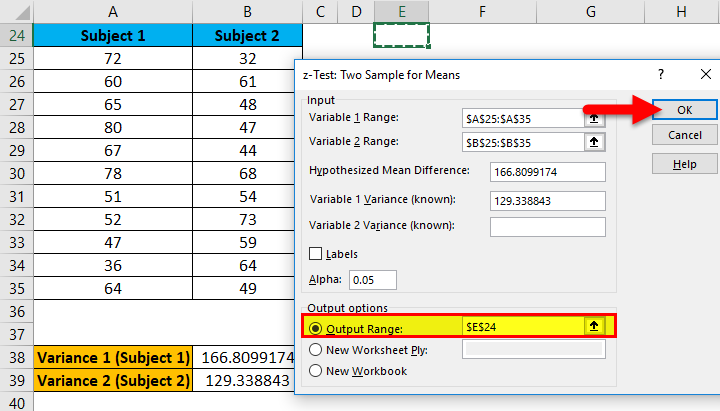
- In Output Range, Select the cell where you want to see the result. Here we have passed cell E24 and then clicked on OK.
The result is shown below:
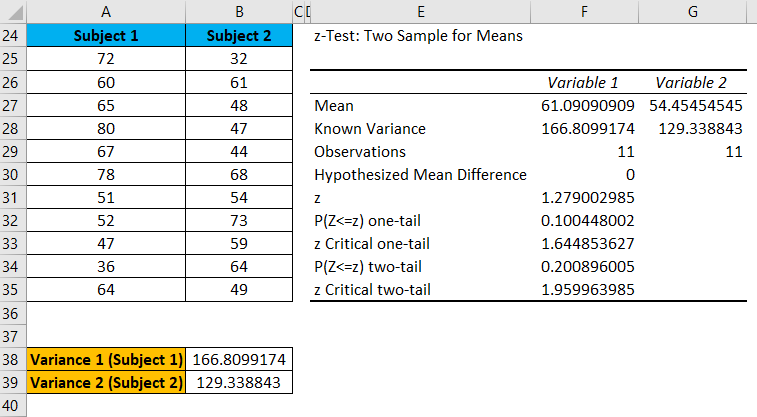
Explanation
- We can reject the null hypothesis if z < -z Critical two-tail or z stat > z Critical two-tail.
- Here 1.279 > -1.9599 and 1.279 < 1.9599; hence we can’t reject the null hypothesis.
- Thus, the means of both populations don’t differ significantly.
Things to Remember
Z test is only applicable for two samples when the variance of both populations is known. While using the Z Test function below error occurs:
- #VALUE! error: If the value of x or Sigma is non-numeric.
- #NUM! error: If the Sigma argument value equals zero.
- #N/A error: If the dataset values or passed array is empty.
- #DIV/0! error: This error occurs in two conditions:
- If the given array contains only one value.
- The sigma is not given, and the standard deviation is zero of the passed array.
Recommended Articles
This has been a guide to Z TEST in Excel. Here we discuss the Z TEST Formula and how to use the Z TEST Function in Excel, along with practical examples and downloadable Excel templates. You can also go through our other suggested articles –
