Updated July 29, 2023
Population Mean Formula (Table of Contents)
- Population Mean Formula
- Examples of Population Mean Formula (With Excel Template)
- Population Mean Formula Calculator
Population Mean Formula
In statistics, the population refers to a group or collection of various entities such as numbers, people, or objects. The population mean represents the average value within this group, calculated by summing all the data points and dividing by the total number of items. While it is a widely used measure to determine the center of a dataset, it is rarely calculated in practice due to its impracticality. This is primarily because populations are often large, and computing the population mean can be extremely time-consuming and expensive. For instance, consider the age of individuals living in Washington, DC, representing a population. Counting every person and computing their average would be a daunting task. Instead, researchers typically extract a smaller subset, known as a sample, which serves as a representative portion of the population. By calculating the average of the sample, they can estimate the average of the entire population.
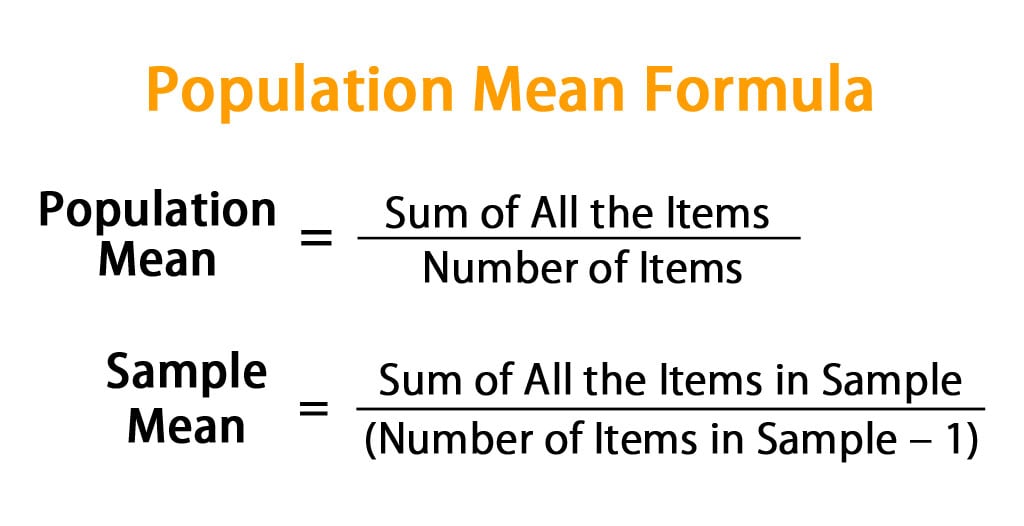
A formula for Population Mean is given by:
In case you want to use the sample mean as representative of the population mean:
Examples of Population Mean Formula (With Excel Template)
Let’s take an example to understand the calculation of the Population Mean formula in a better manner.
Example #1
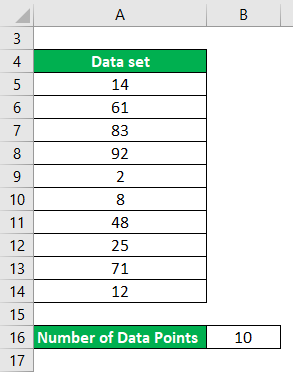
Let’s say you have a data set with 10 data points, and we want to calculate Population Mean for that.
Data set: {14,61,83,92,2,8,48,25,71,12}
Solution:
Population Mean = Sum of All the Items / Number of Items
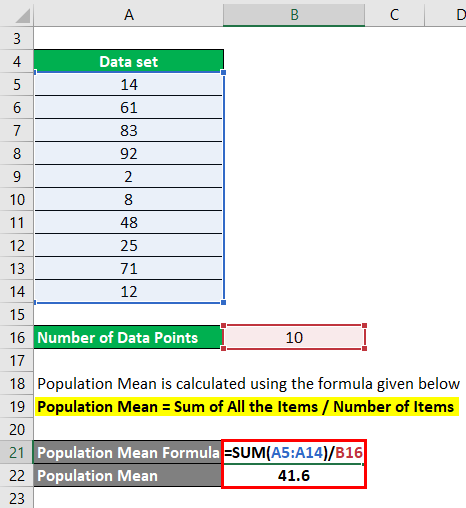
- Population Mean = (14+61+83+92+2+8+48+25+71+12) / 10
- Population Mean = 416 / 10
- Population Mean = 41.6
Example #2
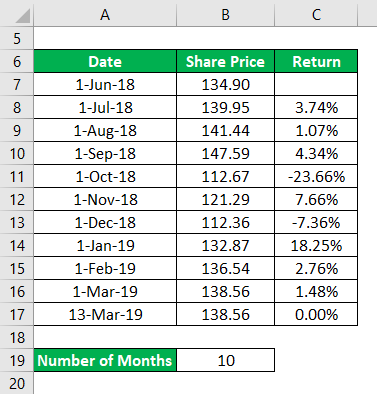
Let’s say you want to invest in IBM and are keen to look at its past performance and returns. You want to go back 20 years and calculate monthly returns, but that will become very hectic. So you have decided to take a sample of the last 10 months and calculate the return and mean. You believe that the sample you have taken correctly represents the population.
Solution:
So if you see here, in the last 10 months, IBM’s return has fluctuated very much.
Sample Mean is calculated using the formula given below
Sample Mean = Sum of All the Items in Sample / (Number of Items in Sample – 1)
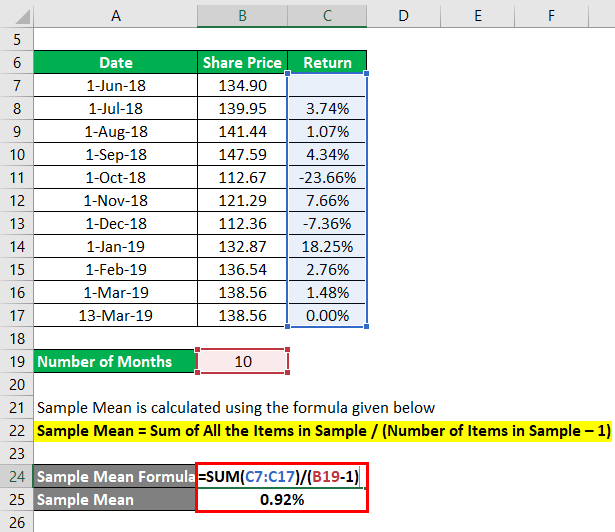
- Sample Mean = (3.74% + 1.07% +4.34% + (-23.66)% + 7.66% + (-7.36)% + 18.25% + 2.76% + 1.48% + 0.00%) / (10 – 1)
- Sample Mean = 8.28% / 9
- Sample Mean = 0.92%
Overall, the average return in the last 10 months is only 0.92%.
Explanation
Mean, in general, is a simple average of the data points we have in a data set, and it helps us to understand the average point of the data set. But there are certain limitations to using mean. These limitations are valid for both Population and Sample Mean. First of all, the mean value is easily distorted by extreme values. For example: Let’s say we have returns of stock for the last 5 years given by 5%, 2%, 1%, 5%, -30%. The mean for these values is -3.4% ((5+2+1+5-30)/5). So although the stock has provided a positive return for the first 4 years, we have a negative mean of 3.4% on average.
Similarly, if we have a project for which we analyze the cash flow for the next 5 years. Let’s say the cash flows are: -100, -100, -100, -100, and +1000. The mean is 600 / 5 = 120. Although we have a positive mean, we are only getting money in the last year of the project, and it can happen that if we incorporate the time value of money, this project will not look as lucrative as it is now.
Relevance and Uses of Population Mean Formula
In general, Population Mean is very simple yet one of the crucial elements of statistics. It is the basic foundation of statistical analysis of data. It is very easy to calculate and easy to understand also. But as mentioned above, the population means is difficult to calculate, so it is more of a theoretical concept. Spending enormous efforts to find a mean population set does not make sense. So sample mean is a more realistic and practical concept. Also, if looked at in a silo, the mean value has relatively less significance because of the flaws discussed above, and it is more of a theoretical number. So we should use mean values very carefully and not analyze the data only based on the mean.
Population Mean Formula Calculator
You can use the following Population Mean Calculator
| Sum of All the Items | |
| Number of Items | |
| Population Mean Formula | |
| Population Mean Formula | = |
|
|
Recommended Articles
This has been a guide to Population Mean Formula. Here we discuss how to calculate Population Mean along with practical examples. We also provide a Population Mean calculator with a downloadable Excel template. You may also look at the following articles to learn more –
