Updated August 23, 2023
T.TEST in Excel (Table of Contents)
T.TEST in Excel
The T-Test function in Excel is used for calculating the probability of significant difference between two data sets, whether any or both are under the same population with the same mean. T-Test also includes whether the data sets we use for calculation is a one-tail distribution or two-tail distribution with a kind of variance that may be equal or unequal.
T.TEST Formula in Excel:
The Formula for the T.TEST Function in Excel is as follows:
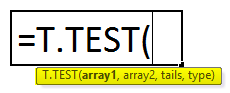
The Formula of T.TEST includes 4 types of arguments:
Array1: This is the first set of the sample you are testing.
Array2: This is the second set of the sample you are comparing.
Tails: This is the number of tails for the distribution. There are two types of tails are there. 1. One-tailed distribution and 2.Two-tailed distribution
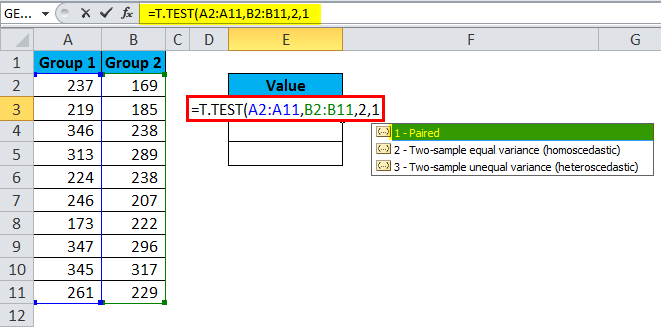
Type: There are 3 types of T.Test available in statistics.
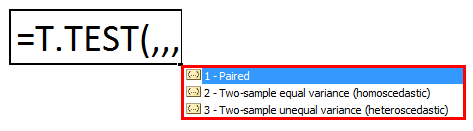
- Paired, this examines whether the mean between paired sets is equal.
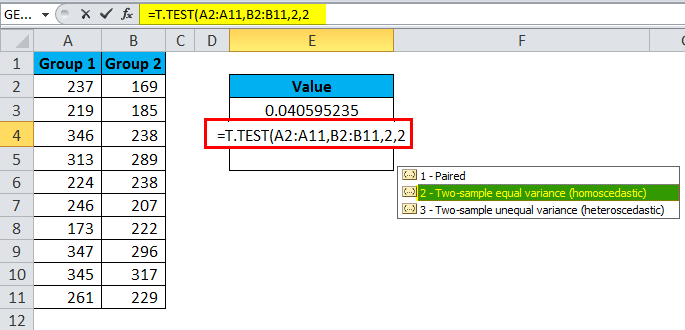
- Two-sample equal variance examines whether the variance of means between two sets is equal.
- Two-sample unequal variance examines whether the variance of means between two sets is unequal.
In recent versions, T.TEST has been introduced. In earlier versions, TTEST is the formula. Still, it is available in recent versions to support compatibility.
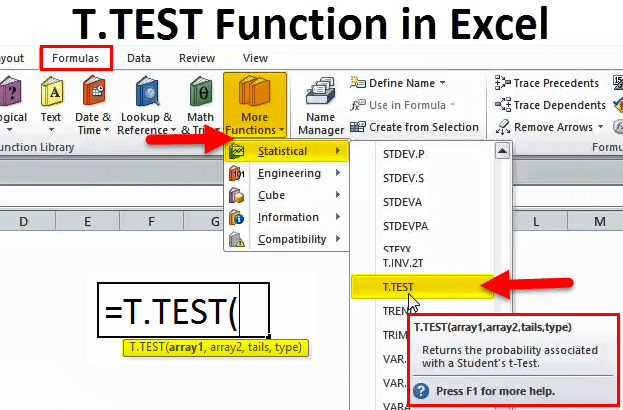
How to Use T.TEST Function in Excel?
T.TEST Function in Excel is very simple and easy to use. Let us understand the working of T.TEST in Excel with Some Examples.
Example #1
The functionality of the T.TEST in Excel can be best explained by using an example dataset to get the logic of the T.TEST.
I have Group 1 and Group 2 test scores for a classroom. I need to run T.TEST to find a significant difference between these two groups.
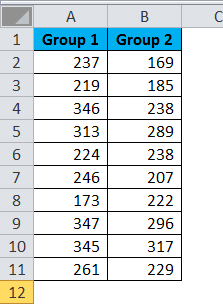
Apply T.TEST to get the difference.
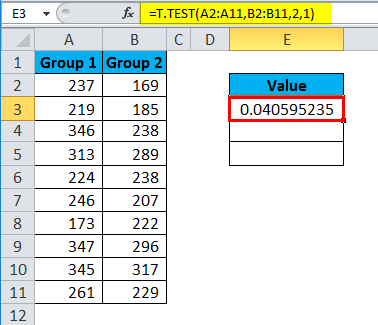
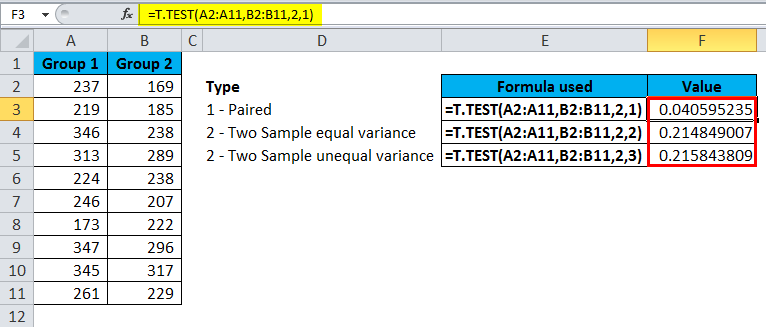
The first test is a type of Paired.
The result is 0.04059.
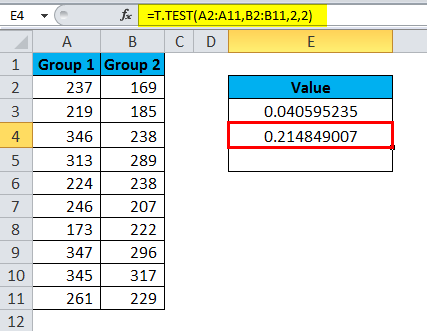
The second test is a type of Two Samples equal variance.
The result is 0.2148.
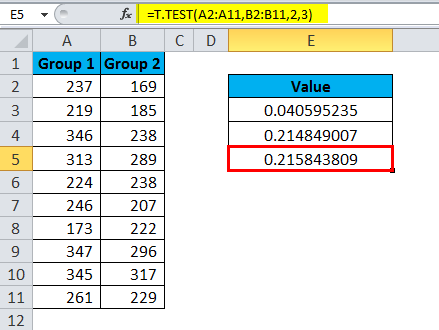
The third test is a type of Two Sample unequal variance.
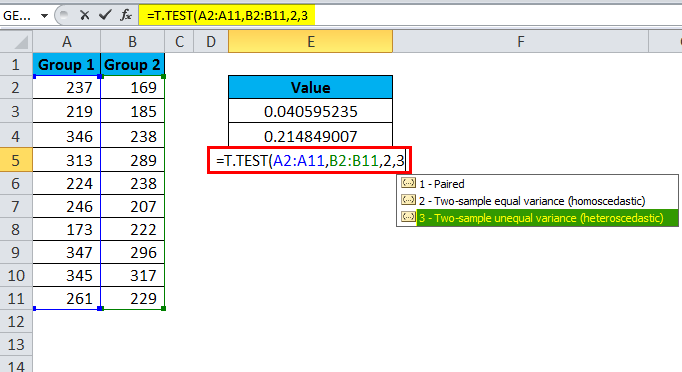
The result is 0.2158.
The returned value is generally called the P-value. If the P-value is <0.05, we can come to the conclusion that the two sets of data have a different mean. Otherwise, the two means are not significantly different from each other.
Example #2
I have the salary numbers of two different departments. I want to find out if the mean of the two departments’ salaries is significantly different.
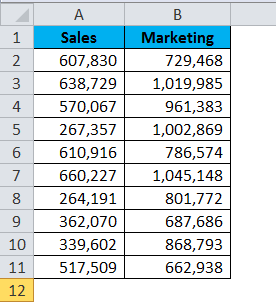
Apply the T.TEST function to see the difference.
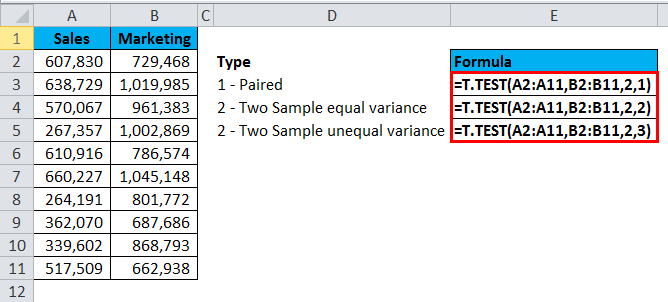
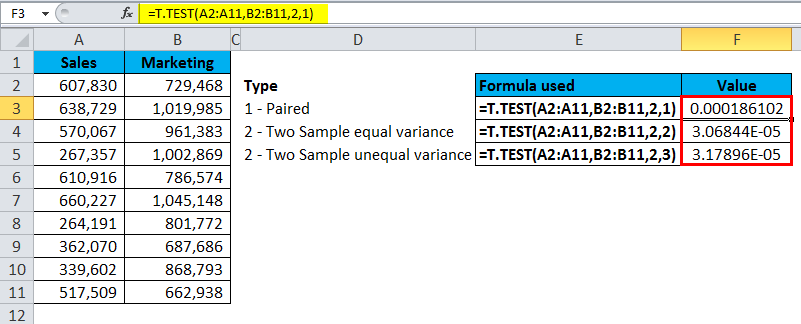
The above formula returns the result as:
Run T.TEST using Analysis Tool Pack
We can run the T.TEST using the analysis tool pack under the Data ribbon tab.

If you do not find this option in your Excel, follow the below steps to unhide this.
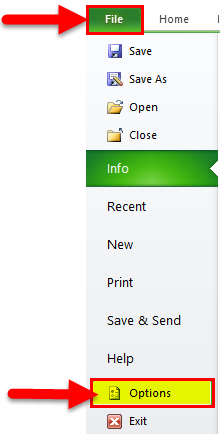
Step 1: Go to File and Options
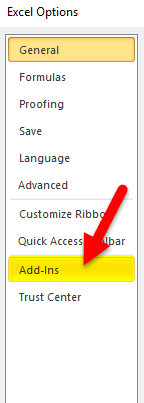
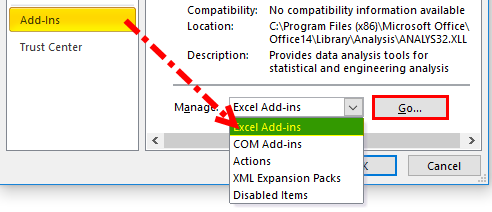
Step 2: Click on Add-Ins
Step 3: Select Excel Add-ins and click Go
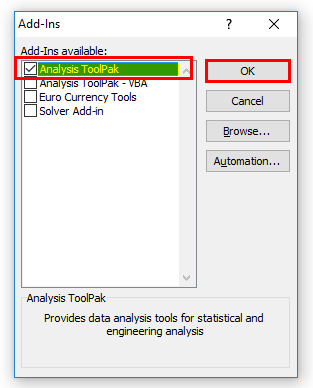
Step 4: Select Analysis ToolPak and click OK.
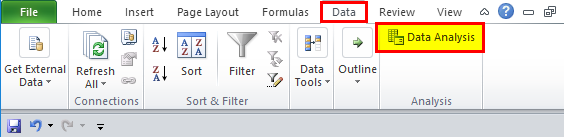
Step 5: This must have enabled the Data Analysis Option.
Follow the below Steps to Run T.TEST using Data Analysis ToolPak
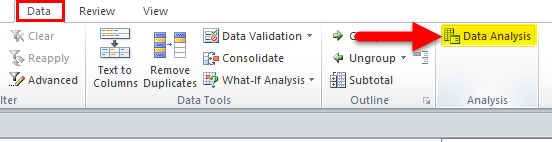
Step 1: Click on Data Analysis under the Data tab.
Step 2: Scroll down find the t-Test.
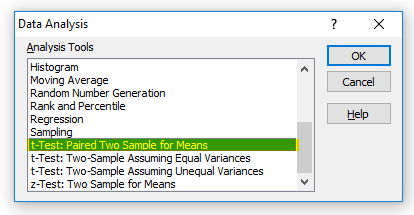
Step 3: Click on the first t-test, and it will open the below dialogue box.
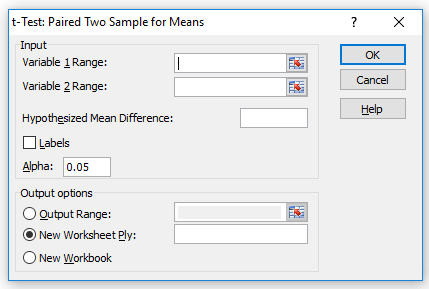
Step 4: Select the Variable 1 range and Variable 2 range.
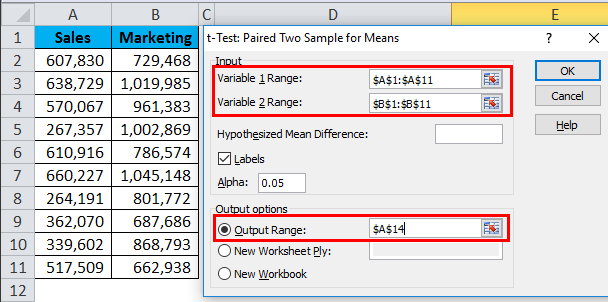
Step 5: Once all the above boxes filled, click on the OK button.
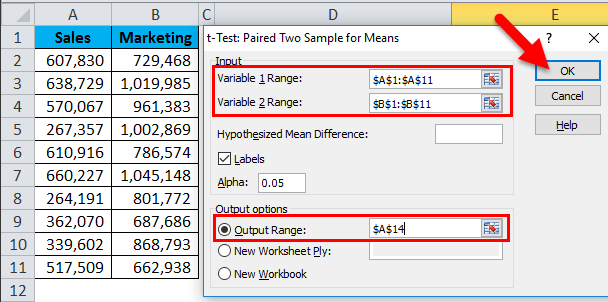
It will show a detailed report.
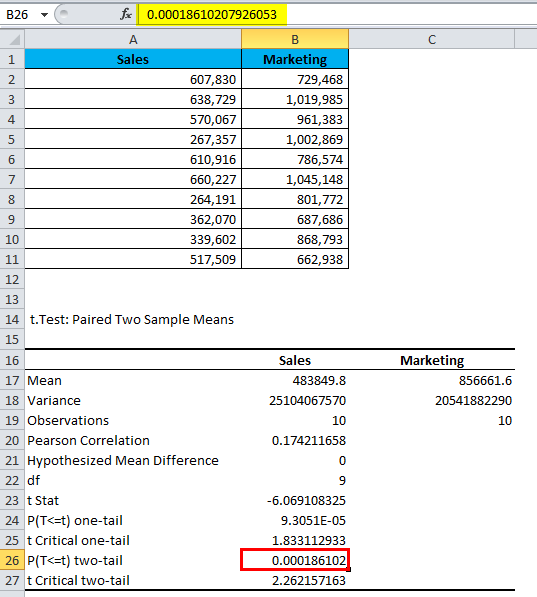
This will show the mean of each data set, their variance, how many observations are considered, correlation, and P-value.
We need to see the P-value (refer to B26), i.e. 0.000186102, which is way below the expected P-value of 0.05.
Our data is significant as long as the P-value is less than 0.05.
Things to Remember
- The T.TEST can accept only numerical values, anything other than numerical values; we get the result of #VALUE!
- If the tails value exceeds 1 or 2, we will get #NUM! error
- Learn the difference between the one-tailed and two-tailed tests to understand it better.
- One assumption is that samples have been randomly drawn from large data.
- The standard P-Value is 0.05 i.e. 5%. Your data is significant if the variance is less than 5%.
Recommended Articles
This has been a guide to T. TEST in Excel. Here we discuss the T.TEST Formula in Excel and how to use T.TEST Function in Excel, along with Excel examples and downloadable Excel templates. You may also look at these useful functions in Excel –
