Updated May 15, 2023
One Variable Data Table in Excel
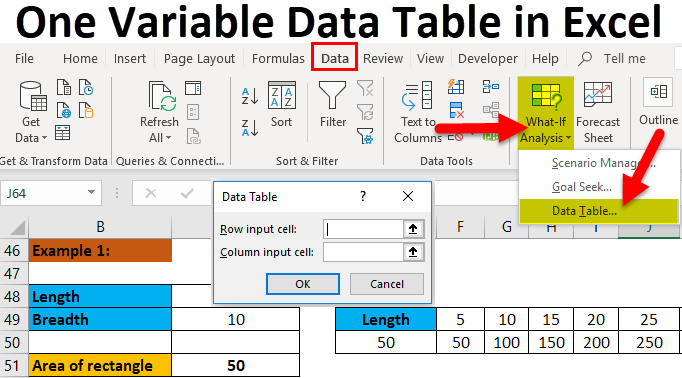
One Variable Data Table in Excel allows users to test how one variable or value in a data table affects the result in the created formula. It is only useful when the formula depends on several values that can be used for one variable. We can test only one input cell for a series of values for the complete data table based on the What-If analysis option, which is available under the Data menu tab.
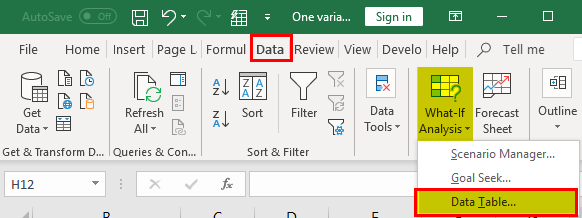
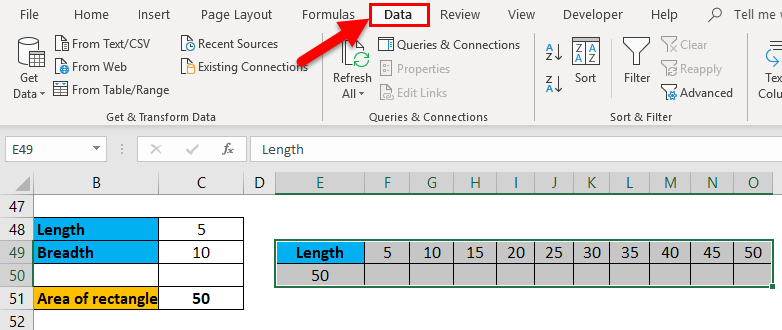
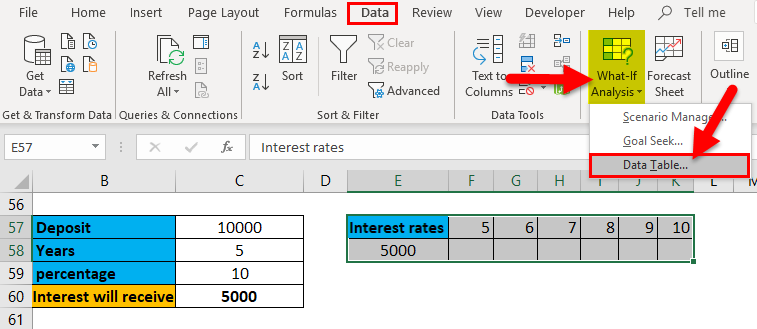
The “What if Analysis” option is under the “Data” tab. Below is the picture for reference.
Now, we know where is “Data table”, and now we will discuss the purpose of the “Data table”. If we keep our cursor on the Data table will get the pop-up to explain the purpose of the data table.
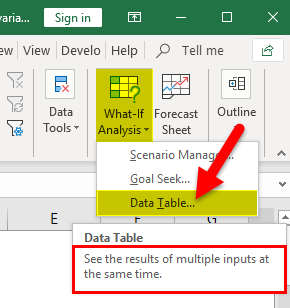
It clearly states the purpose of the Data table, i.e., “See the results of multiple inputs at the same time”. We will discuss briefly what that means exactly.
Example
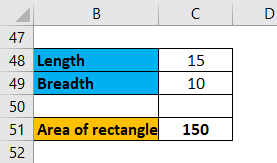
Let’s consider a small example area of the rectangle. We want to find the area of a rectangle for the below values.
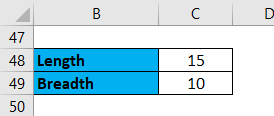
As we all know, the formula for calculating an area of a rectangle is length x breadth (or) length x width. Here length is 15, and Breadth is 10, so a multiple of 15 x 10 = 150.
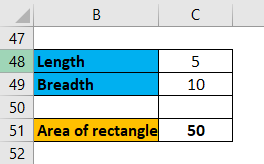
Now, what is the part of the data table here? Suppose we want to know the area of the rectangle for different lengths or breadths; what will we do? We will change the value of length or breadth and check the “Area of a rectangle” results. Now I want to check the area for the length of 5; then, the area will be 50 again if I want to calculate for length 15. I will change the length value and check the results one more time. So when we give 15, we cannot see the results for 5 and 10. This is the case where the Data table helps, where it will display all results for different inputs.
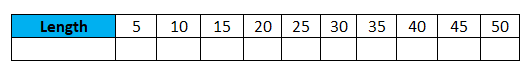
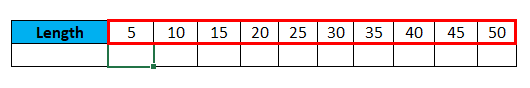
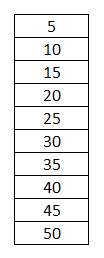
Now I want to check the area for different lengths from 5 to 50 with equal intervals of 5; that mean length should be 5, 10, 15 …50.
We want all the results to be displayed simultaneously, as shown in the picture below.
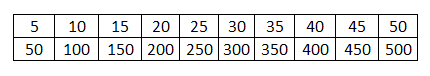
This is what exactly the “Data table” performs. Here we are getting an area of the rectangle simultaneously for the multiple-length inputs.
If we observe one variable varying, that is, in this process, that is the length. Hence, we can call this a “one-variable data table. “
I hope you understand what “Data table” means and what “One variable data table” means.
How to Perform One Variable Data Table in Excel?
One Variable Data Table in Excel is very simple and easy to create. With some examples, let’s understand the working of One Variable Data Table in Excel.
One Variable Data Table in Excel Example #1
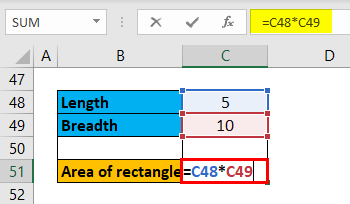
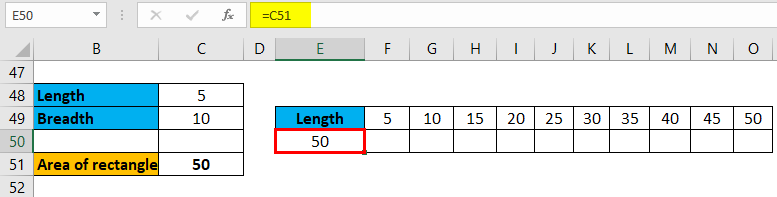
Now we will see how to achieve this in Excel. First, we will give a rectangle’s input length and breadth and apply the rectangle formula in one cell, as shown below.
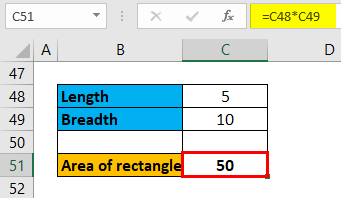
The Output is:
Later give different inputs that we want to test. Here we are taking the inputs in a row. We can give it in rows or columns as we wish.
Now one cell below, and before our first input cell, we need to take the result of an area of the rectangle as shown below.
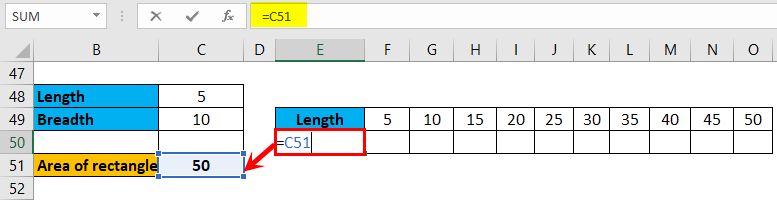
Then the result will pick under the heading length.
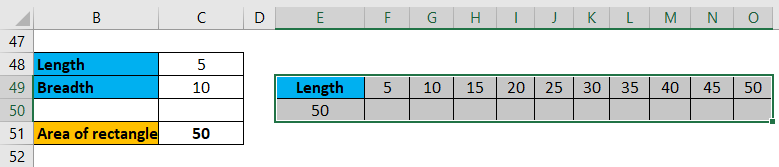
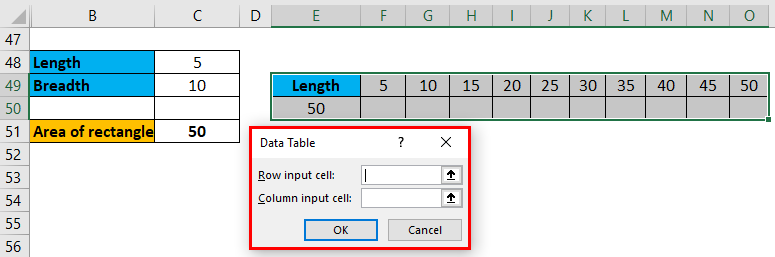
Select the entire data of the second table.
Now, Click on the “Data” tab on the top.
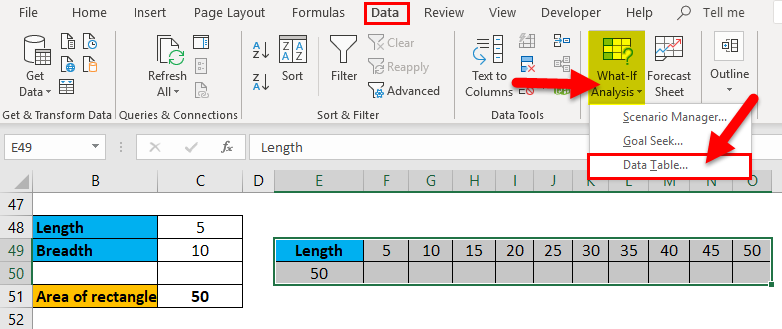
Then click on “what-If analysis” then select “Data table”.
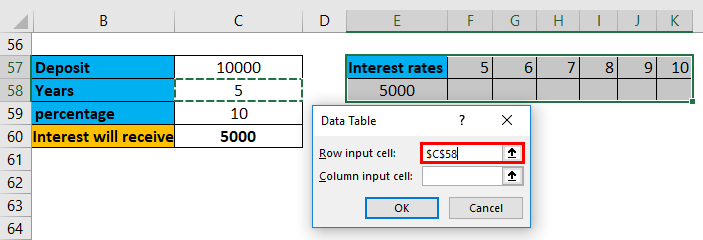
A pop-up will appear asking for “Row input cell” and “Column input cell”.
A rThe row input cell is used when the multiple inputs in the row are like the current example.
![]()
The column input cell is used when multiple inputs are available in columns shown in the picture below.
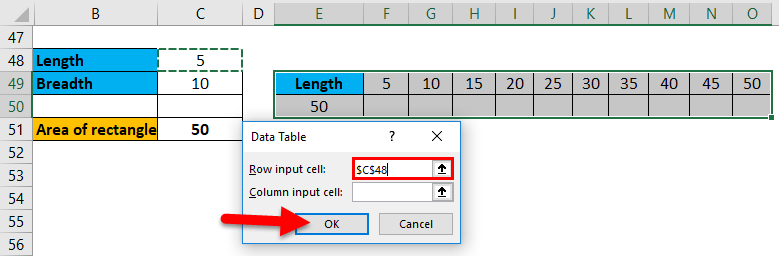
Using the different inputs in a row, we will use row input. Select “row input” and select the cell from where the length input is taken to find the rectangle’s area. Here it is, cell C48. Click on “OK”.
Then automatically, the area of the rectangle calculates for all the inputs and displays the results under each input.
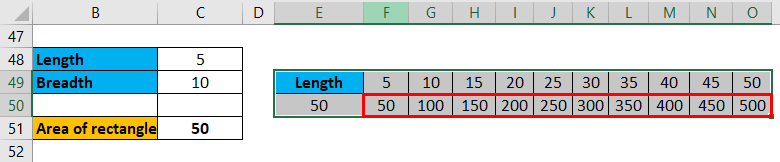
Now we have outputs for different inputs at a time. If inputs are in a column, just select “Column input cell” from the pop-up; there are no other changes in the process.
One Variable Data Table in Excel Example #2
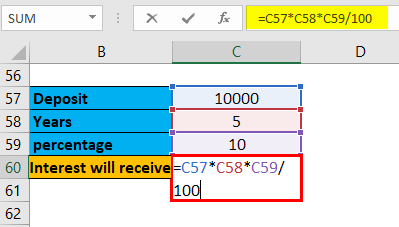
Now we will apply this to simple interest calculation. Suppose we deposited Rupees 10000 for 5 years with an interest rate of 6 percent and want to know how much we will receive if we extend the number of years or deposit in other banks for different interest rates. So, we need to perform two calculations here, one for different interest rates and one for different years.
Apply the Formula here.
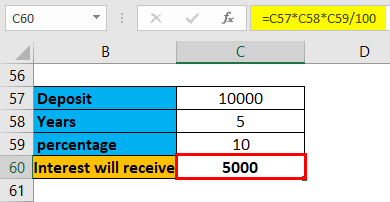
The Output is:
First, we will apply for different interest rates.
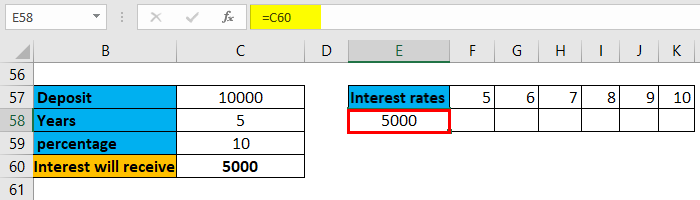
We need to take the result of the interest received.
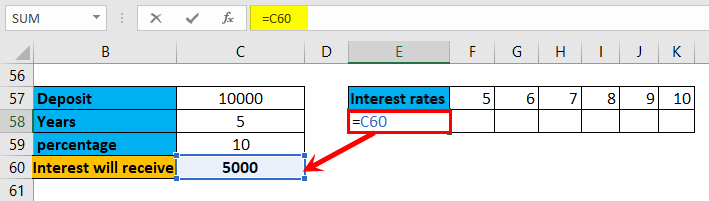
Then the result will pick under the heading length.
Select the table and choose “Data table” from “What-if analysis”.
Select “Row input cell” and Choose the cell years.
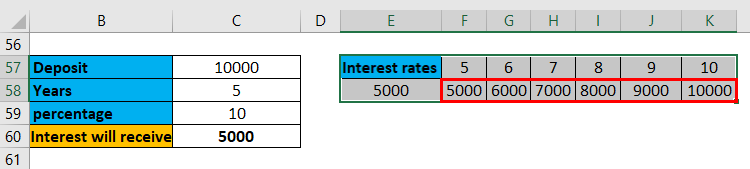
Now we will get the interest amount for different years.
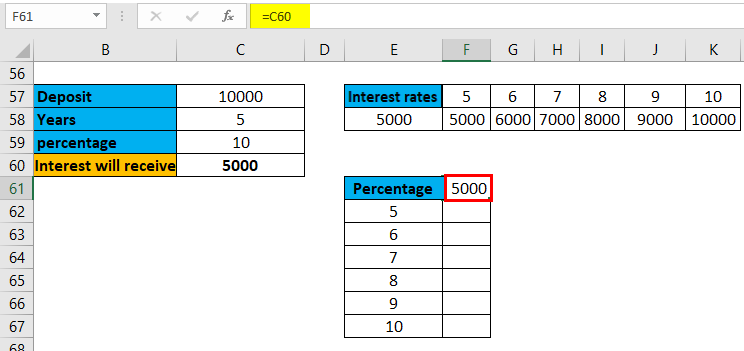
Now we will apply the formula for different percentages.
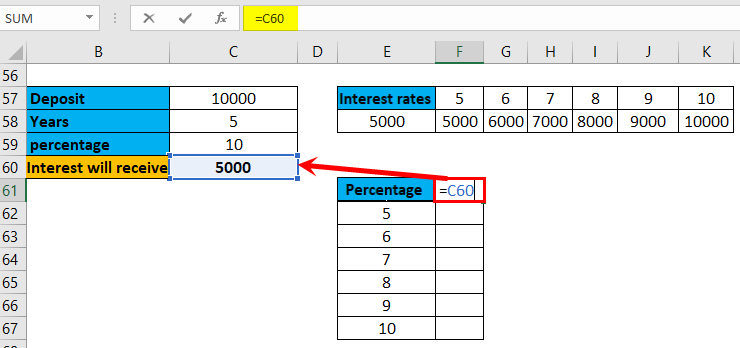
Then the result will pick under the heading length.
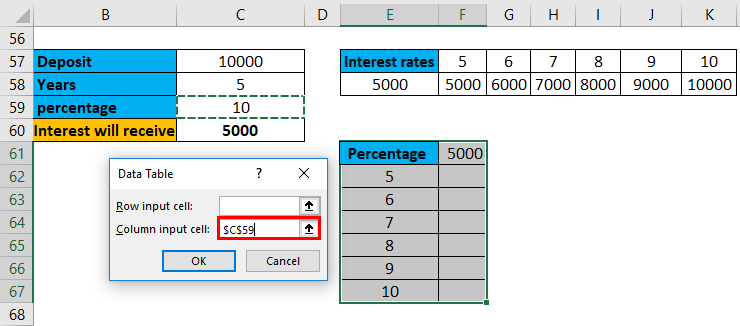
Click on “what-If analysis”, then select “Data table”.Select “Column input cell” and Choose the cell percentage.
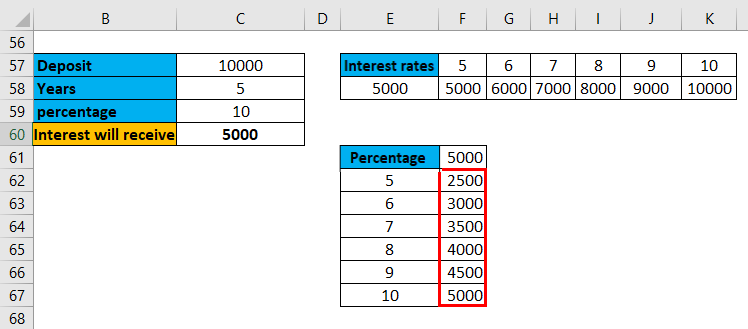
Now we have results for a different number of percentages and different interest rates.
Similarly, we can perform for compound interest, loan installments, etc…
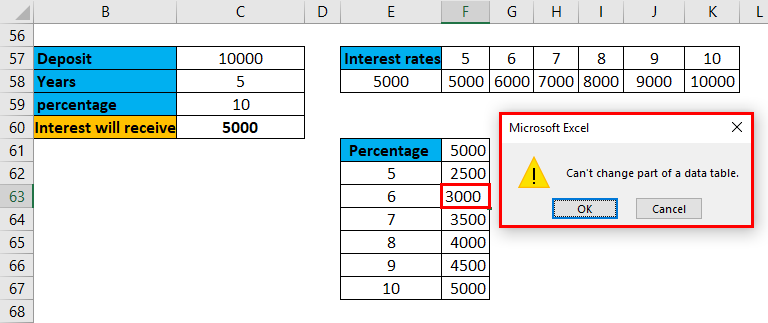
We cannot edit the results of any cell as it is an array, and it will not allow editing any of the results. If we try to edit, it will throw you the below error message.
If we want to remove the results, we need to remove the entire array of results.
Things to Remember About One Variable Data Table in Excel
- A data table is a tool available in the “What if analysis” under the “Data” tab.
- One variable data table helps to find the results for operations with varying inputs simultaneously. Similarly, we can do the two-variable data table where it has two varying inputs for the operation.
- One variable data table can apply for both horizontally or vertically aligned inputs.
- The results displayed are in the form of an array. The array is nothing but a group or collection of elements. As the results are in an array, we cannot edit or delete any data from one particular results cell.
- If we want to remove the data, we need to remove the entire array of results.
- The formula and multiple inputs must be on the same sheet. If we have a calculation in sheet 1 and inputs in sheet 2, it will not allow performing the calculation. Hence make sure they both are on the same sheet.
Recommended Articles
This has been a guide to One-Variable Data Table in Excel. Here we discuss its types and how to create One Variable data table examples and downloadable Excel templates. You may also look at these useful functions in Excel –
