Updated June 8, 2023
Trendline in Excel
The trendline in Excel is part of all the Charts available in the Charts section under the Insert menu tab, which is used to see the trend in the plotted data over any chart. This helps us to see whether there is an increase or decrease in data values. This is also helpful in seeing at which point the data goes up or down. It can be used in any chart type (Except Pie, Donuts). To apply trendline, create a chart using the option available in the Charts section, then click right on any data on the chart and select Add Trendline. We can also insert Trendlines using the Chart Elements list, accessed from the plus sign at the top right corner or any chart.
Types of Trendlines in Excel
There is various type of trendlines in excel:
- Exponential trendline
- Linear trendline
- Logarithmic trendline
- Polynomial trendline
- Power trendline
- Moving Average trendline
Now we will explain one by one the types of Trendline in Excel.
Exponential:
This trendline is mostly used where the data rise or falls constantly. Avoid this trendline if the data contains zero or negative values.
Linear:
This trendline is useful for creating a straight line to show the increasing or decreasing of data values at a straight line.
Logarithmic:
This trendline is useful where the data suddenly increases or decreases and then becomes stable at some point. In this trendline, you can include the negative values in the dataset.
Polynomial:
This trendline is useful where you see gain or loss in the business. The degree of this trendline shows the number of fluctuations in the data.
Power:
This trendline is useful where the dataset compares results that increase at a fixed rate. Avoid this trendline if your dataset contains Zero or negative values.
Moving Average:
This trendline shows the pattern clearly in the dataset, which smoothes the line. This trend is mostly used in Forex Market.
How to Create a Trendline in Excel?
Creating a Trendline in Excel is very simple and easy. Let’s understand the creation of Trendline in Excel with some examples.
Example #1
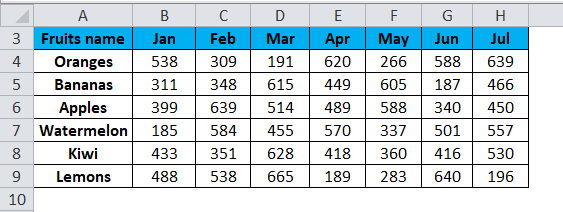
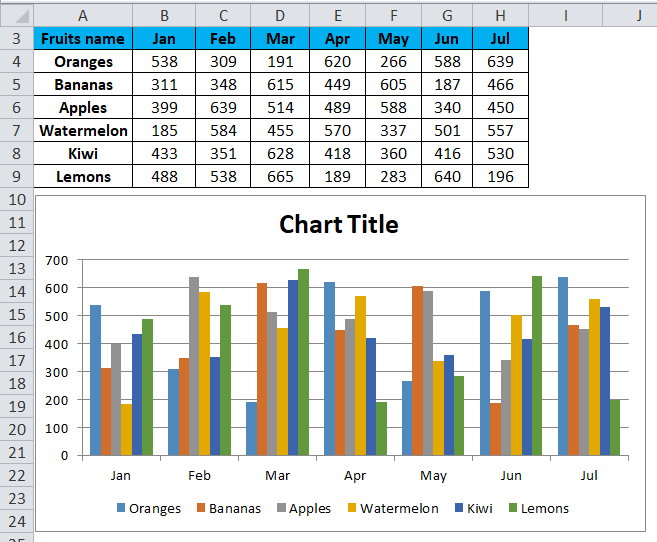
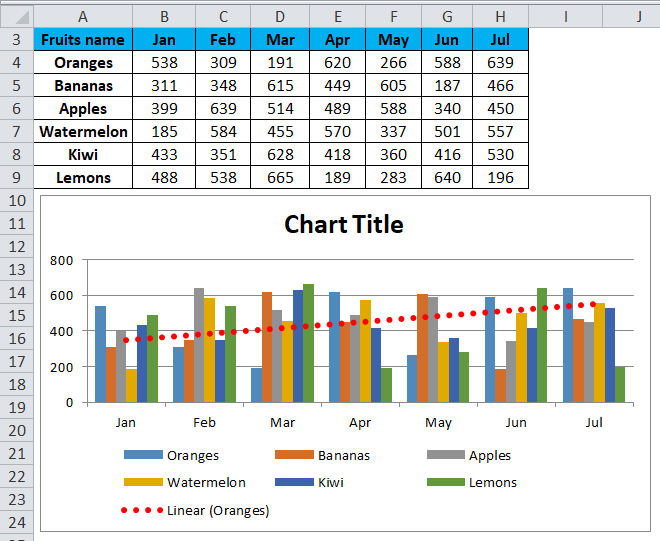
Suppose we have given the fruit’s name & their production number month wise.
To create a trendline in Excel, follow the below steps:
- Select the whole data, including the headings.
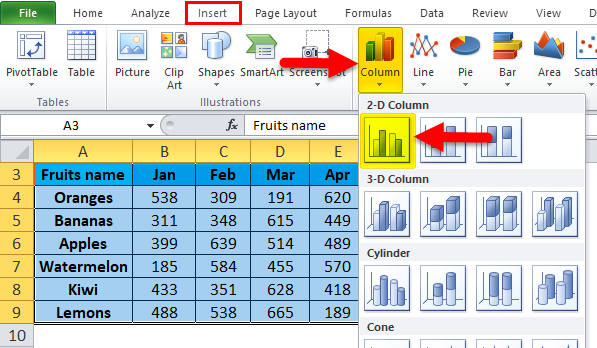
- Go to the INSERT tab.
- Click on Column Charts under the Charts section and then select 2-D Column Chart, as shown in the below screenshot.
- It will create a Column chart on the given data, as shown below.
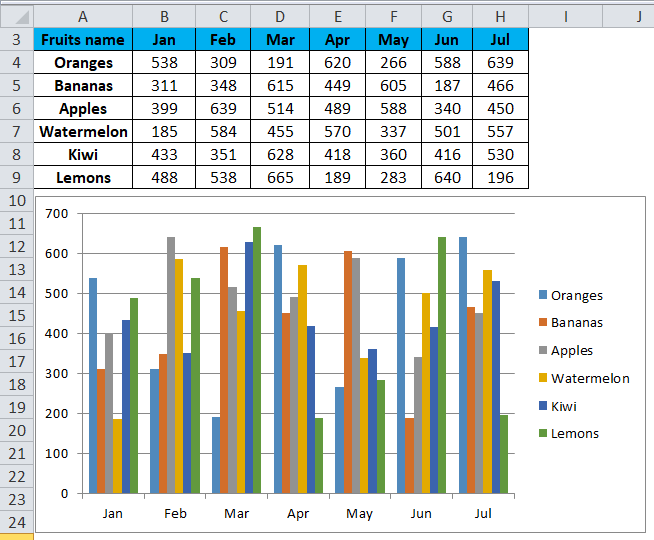
- After formatting Legend and adding the chart title, the chart will look as below:
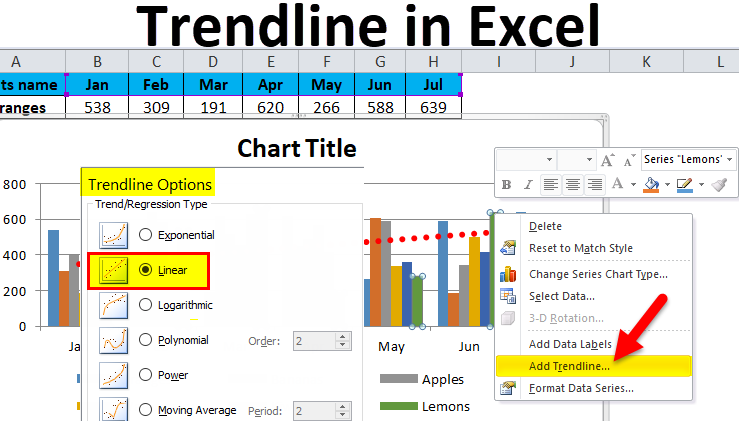
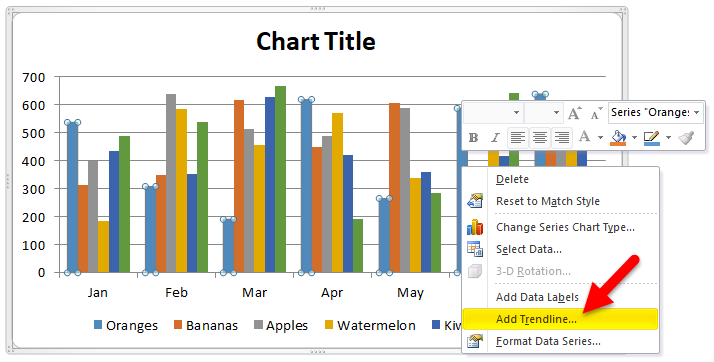
- Click on Chart Area and do right-click. It will open a drop-down list of some options, as shown in the below screenshot.
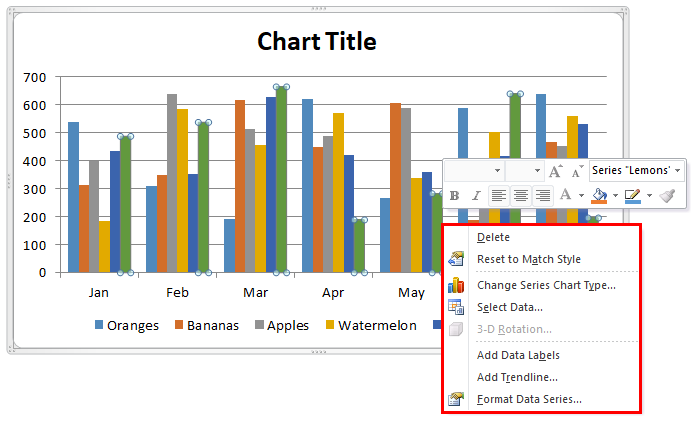
- Click on Add Trendline option from the drop-down list.
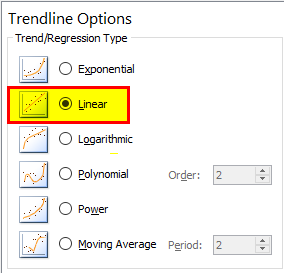
- It will open a Format Trendline box, as shown in the below screenshot.
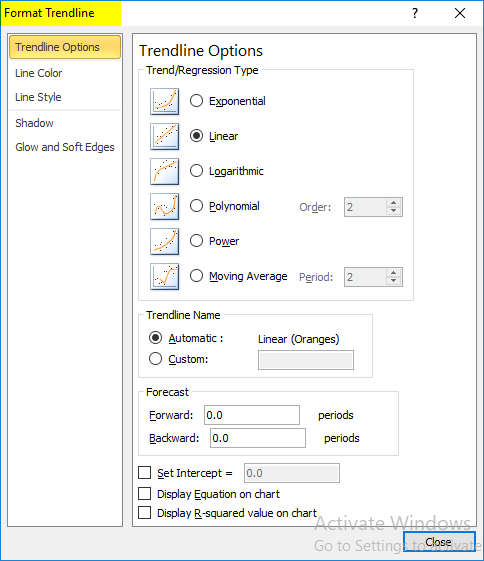
- Make sure that the Linear option is selected. Refer to the below screenshot.
- You can format the trend line using the Fill & Line option.
- It will create the linear trendline in your chart, as shown below.
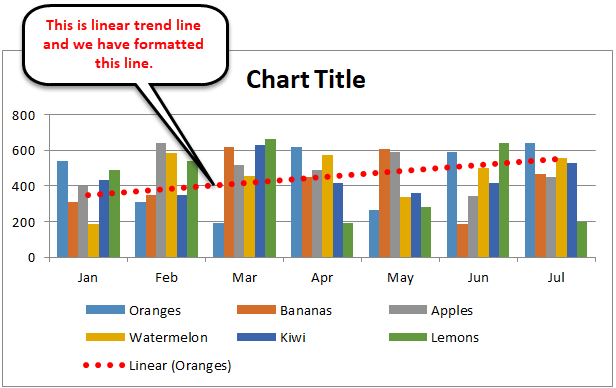
- Through this trendline, we can predict the growth of the business.
Example #2
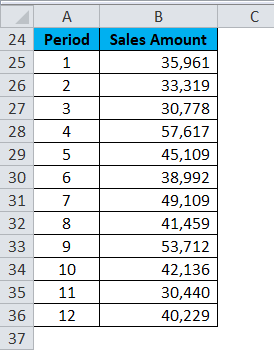
We have given the sales amount period-wise.
To create a trendline in Excel, follow the below steps:
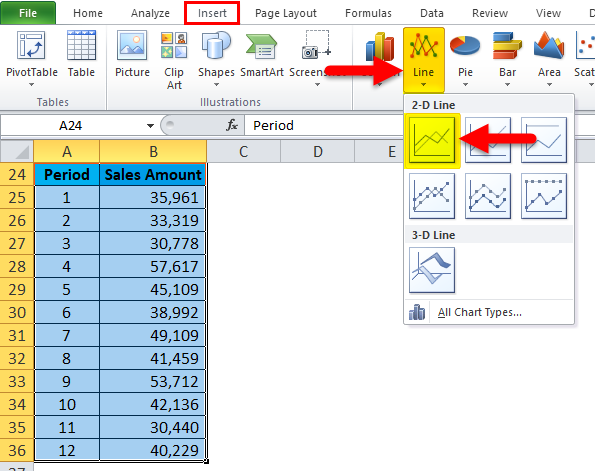
- Select the whole data, including Column headings.
- Go to the Insert tab, choose the Line chart, and click OK. Refer to the below screenshot.
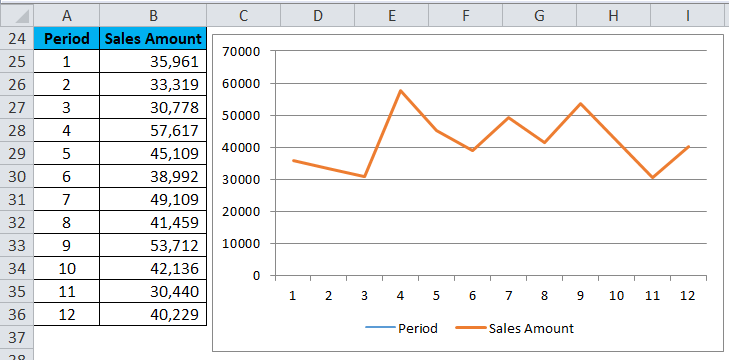
- The chart is shown below:
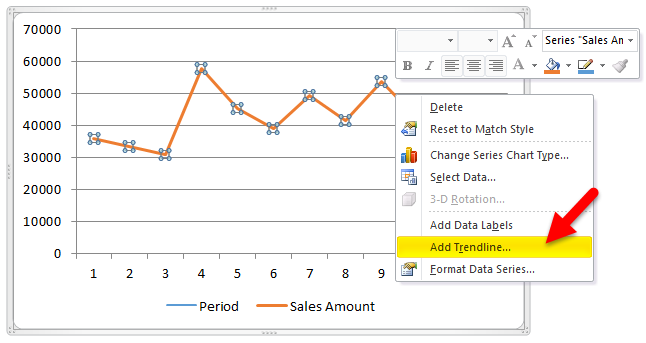
- Now do, right-click on the line of a line chart and choose the option Add Trendline. Refer to the below screenshot.
- It will open the Format Trendline window.
- Make sure that the Linear option is selected.
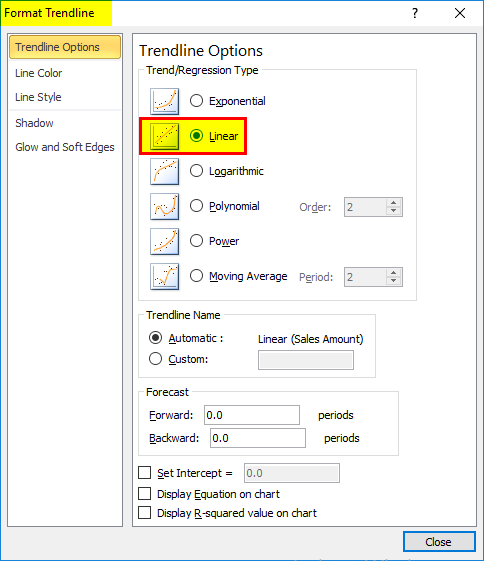
- Now close the window, and it will insert the trendline in your chart. Refer to the below screenshot.
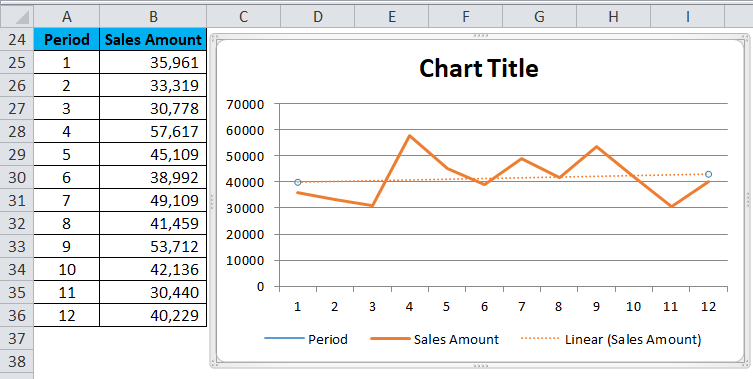
Now from the trendline, you can predict the flow of business growth.
Things to Remember
- Check for the R-squared value to know the most suitable trendline for your dataset.
- When R-value is at or near 1, it’s most reliable.
- When you create a trendline for your chart, it automatically calculates R squared value.
Recommended Articles
This has been a guide to Trendline in Excel. Here we discuss its types and how to create a trendline in Excel, along with Excel examples and a downloadable Excel template. You may also look at these useful charts in Excel –
