Updated August 23, 2023
Excel Variance (Table of Contents)
Introduction to Variance in Excel
We use Variance when we have some budgets, and we may know the variances observed in implementing the budgets. Sometimes, the term variance calculates the difference between the planned and the actual results. Variance calculation is a great way for data analysis as this lets us know the spread of variation in the data set.
Variance is nothing but information that shows how well the data is spread. Calculating variance is required, especially in cases where we have been sampling data. This is important because we use the correct function to calculate the variance, like VAR.S or VAR.P. We have a few cases to calculate variance in Excel where we have some data that has been projected for the period. We want to compare that with the actual figures.
How to Calculate Variance in Excel?
Let’s understand how to Calculate Variance in Excel with some examples.
Example #1 – Calculating variance in Excel for the Entire Population
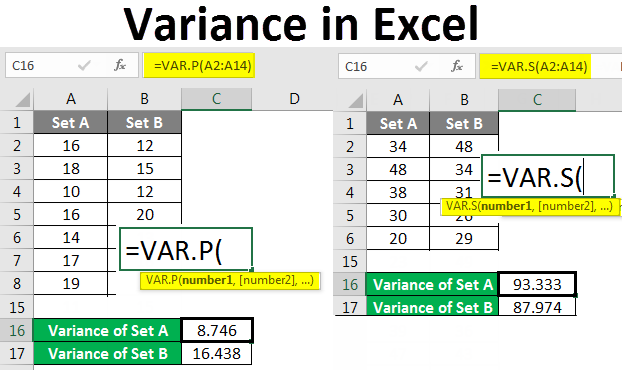
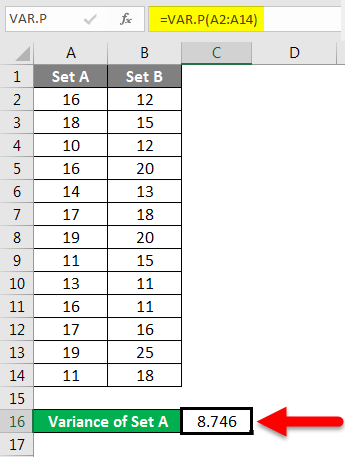
If the data set is for the complete population, then we need to use the VAR.P function of Excel. This is because, in Excel, we have two functions designed for different datasets.
We may have data collected based on sampling, which might be the entire world’s population.
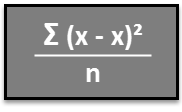
VAR.P uses the following formula:
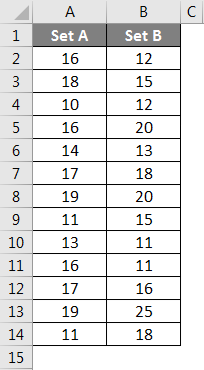
Step 1 – Enter the data set in the columns.
Step 2 – Insert the VAR.P function and choose the range of the data set. Please note that we should ignore any cell with errors when calculating variance.
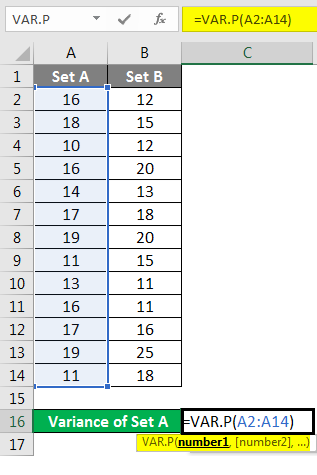
Step 3 – We will get the variance after pressing the Enter key.
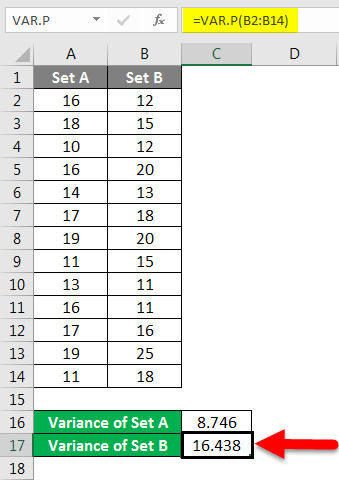
We have calculated the variance of Set B by following the same steps above. The result of the variance of Set B is shown below.
Example #2 – Calculating the variance for sample size in Excel
If we have data set that represents samples, then we need to use the function of VAR.S instead of using the VAR.P
Considering the sampling method’s characteristics, this function has been designed to calculate the variance.
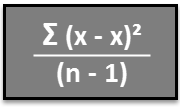
VAR.S uses the following formula:
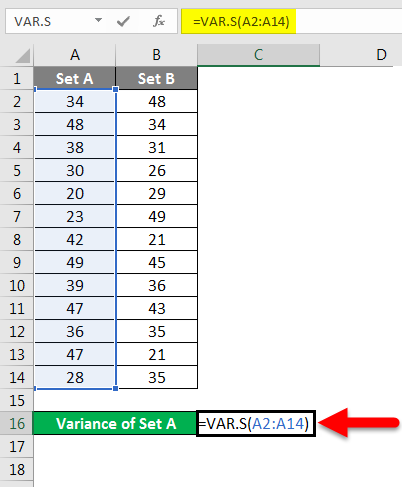
Step 1 – Enter the data set in the column.
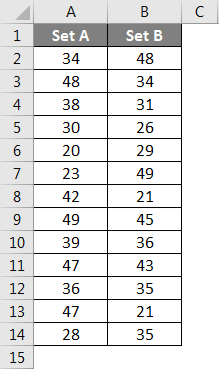
Step 2 – Insert the VAR.S function and choose the range of the data set.
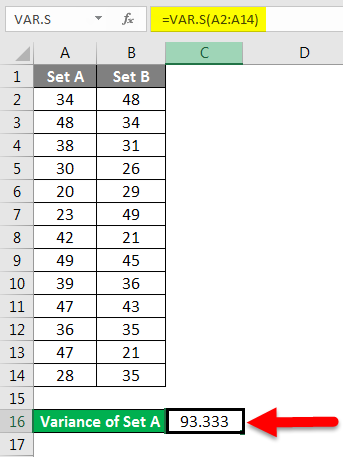
Step 3 – We will get the variance.
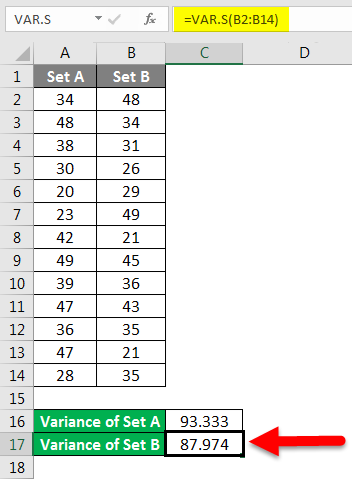
We have calculated the variance of Set B by following the same steps above. The result of the variance of Set B is shown below.
Example #3 – Calculating the quantum of variance for data in Excel
We may just want to calculate the variance in the data, and we may need the variance in quantity and not in data analysis.
If we need to check the change, we must use the following method.
Step 1 – Calculate the difference between the two of the data by using the subtraction function.
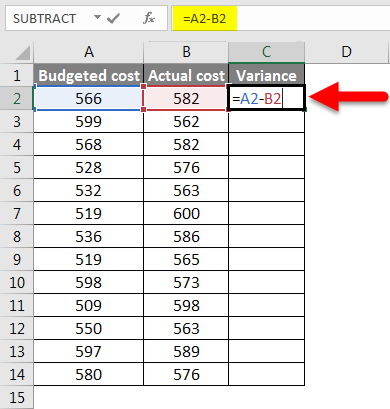
Step 2 – We will get the result after pressing the Enter key. We have to drag the formula applied to cell C2 to get the entire data variance.
Step 3 – The variance, which will be the calculated variance, can be positive or negative.
Example #4 – Calculating the percentage of variance for the data set in Excel
We may need to calculate the percentage change in the data over a period of time, and in such cases, we need to use the below method.
Step 1 – First, calculate the variance from method 3rd.
Step 2 – Now calculate the percentage by using the below function.
Change in the value/original value*100. This will be our percentage change in the data set.
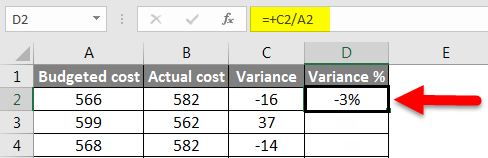
Step 3 – To get the percentage of the entire data variance, we have to drag the formula applied to cell D2.
Things to Remember About Variance in Excel
- If we have data set that represents the complete population, then we need to use the function of VAR.P.
- If we have a data set representing the samples from the world data, then we need to use the function of VAR.S.
- Here S represents the samples.
- If we calculate the change in terms of quantum, a negative change means an increase in actual value, and a positive change means a decrease in value.
- When using the VAR.P, the arguments can be numbers or names, arrays, or references containing numbers.
- If any of the cells given as a reference in the formula contains an error, that cell will be ignored.
Recommended Articles
This is a guide to Variance in Excel. Here we discussed How to calculate Variance in Excel, practical examples, and a downloadable Excel template. You can also go through our other suggested articles –
