Updated October 12, 2023
als==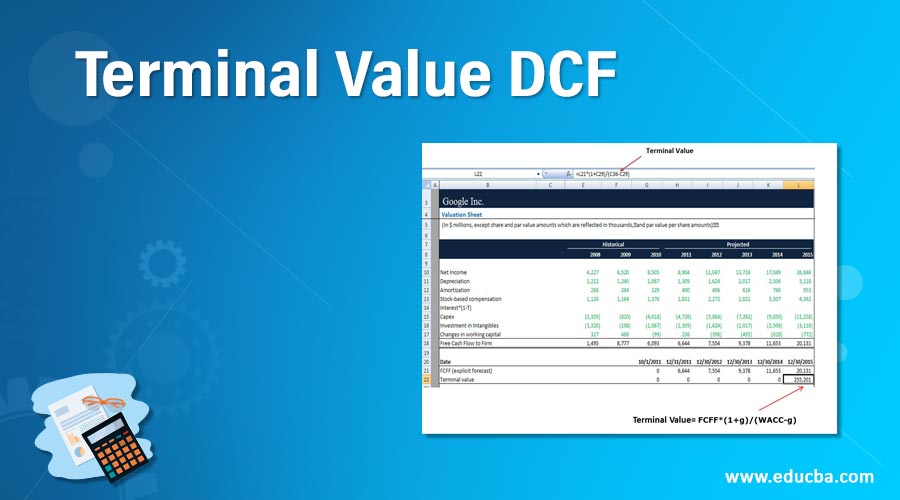
Definition of Terminal Value in DCF
Terminal value is the value of an investment at the end of a specific period, including a specified interest rate. With terminal value calculation, companies can easily forecast future cash flows.

So what went wrong with Mr. Bosch’s investment strategy?
It’s a good thing that he took inspiration from Robin, but before investing in the stocks, he could have researched the company where he wanted to invest his precious money.
Let’s see what kind of research would have benefited his case.
Hopeful investors are always curious about knowing the company’s future cash flow. But as we know, the publicly traded organization has an infinite lifetime. Hence, we can’t estimate the cash flows forever. Therefore, we can estimate the cash flows for a particular growth period. And for long-term cash flow growth, we use a terminal value approach based on some assumptions.
Terminal Value in DCF (Discounted Cash Flow) Approach
Terminal value is the value of an investment at the end of a specific period, including a specified interest rate. With terminal value calculation, companies can easily forecast future cash flows.
When calculating terminal value, the formula depends on the assumption that the last projected year’s cash flow will stabilize and continue at the same rate forever. There are different ways to find out the terminal value of cash flows. The most popularly used is the Gordon Growth Model, where a company’s value is Perpetuity.
Gordon Growth Model
This model assumes that the company will continue its historic business and generate FCFs at a steady state.
In this method, the formula to calculate the terminal value is as follows:
Where,
g = Perpetuity growth rate (at which FCF grows)
WACC= Weighted Average Cost of Capital (Discount Rate)
This formula is purely on the assumption that the cash flow of the last projected year will be steady and continue at the same rate forever.
The perpetuity growth rate is the rate that is between the historical inflation rate and the historical GDP growth rate. Thus, the growth rate is between the historical inflation rate of 2-3% and the historical GDP growth rate of 4-5%. Hence, if the growth rate is assumed to be over 5%, you expect the company’s growth to outperform the economy’s growth forever.
Example:
For “XYZ Co.” we have forecasted a free cash flow of $22 million for year 5, and the discount rate is 11% if we assume that the company’s cash flows will grow by 3% per year.
We can calculate the terminal value as follows:
XYZ Co. terminal value = $22Million X 1.03/ (11% – 3%)
= $283.25M
Let’s see an example of a real company, like Google Inc.
Follow the below steps for terminal value in DCF
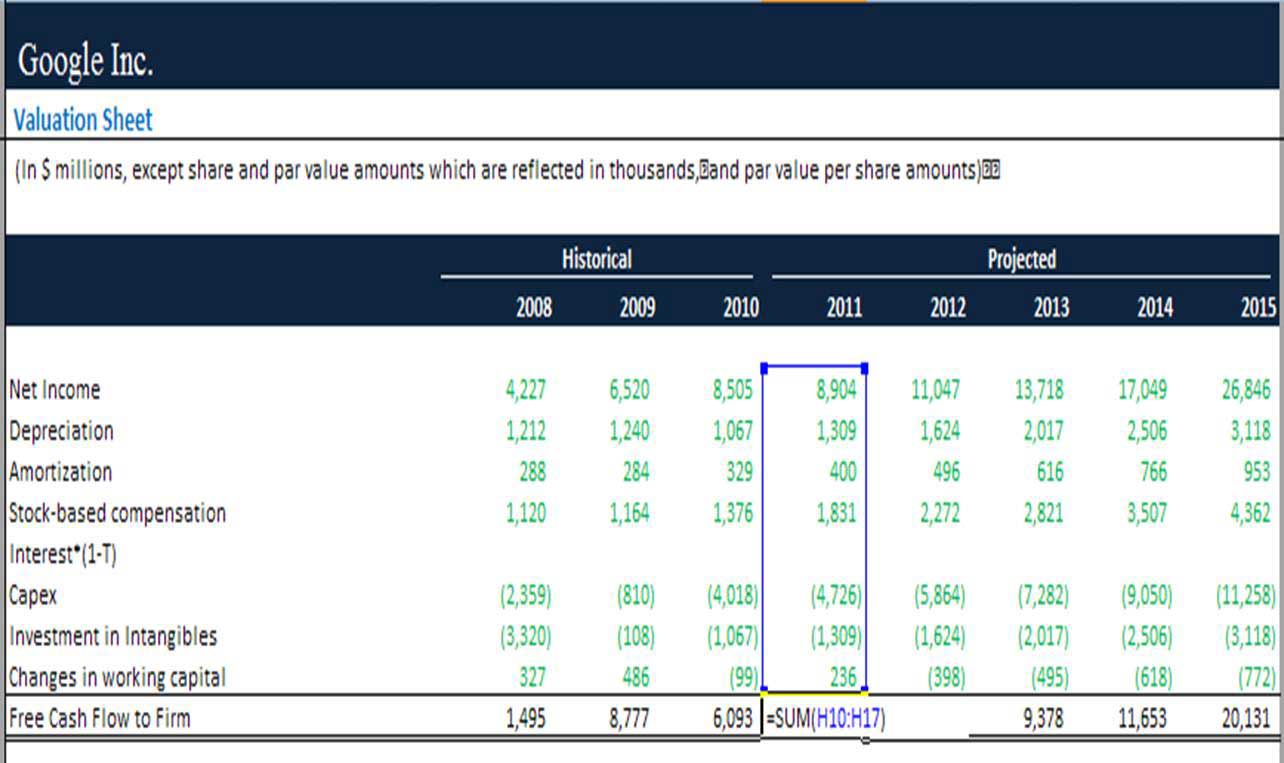
Step 1: Free Cash Flow Calculation
First, we need to calculate the free cash flow to the firm. This is a crucial step for determining the terminal value based on the fifth year’s cash flow; we will calculate the terminal value.
In this, we require the following information:
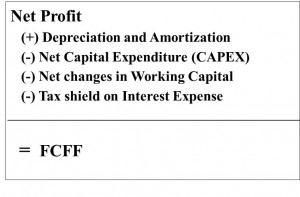
- Net Income of the firm
- Depreciation and amortization expenses
- Stock-based compensation
- Interest after tax
- Capital expenditure
- Intangibles investment
- Changes in working capital
Following is the formula used for calculating free cash flow to the firm:
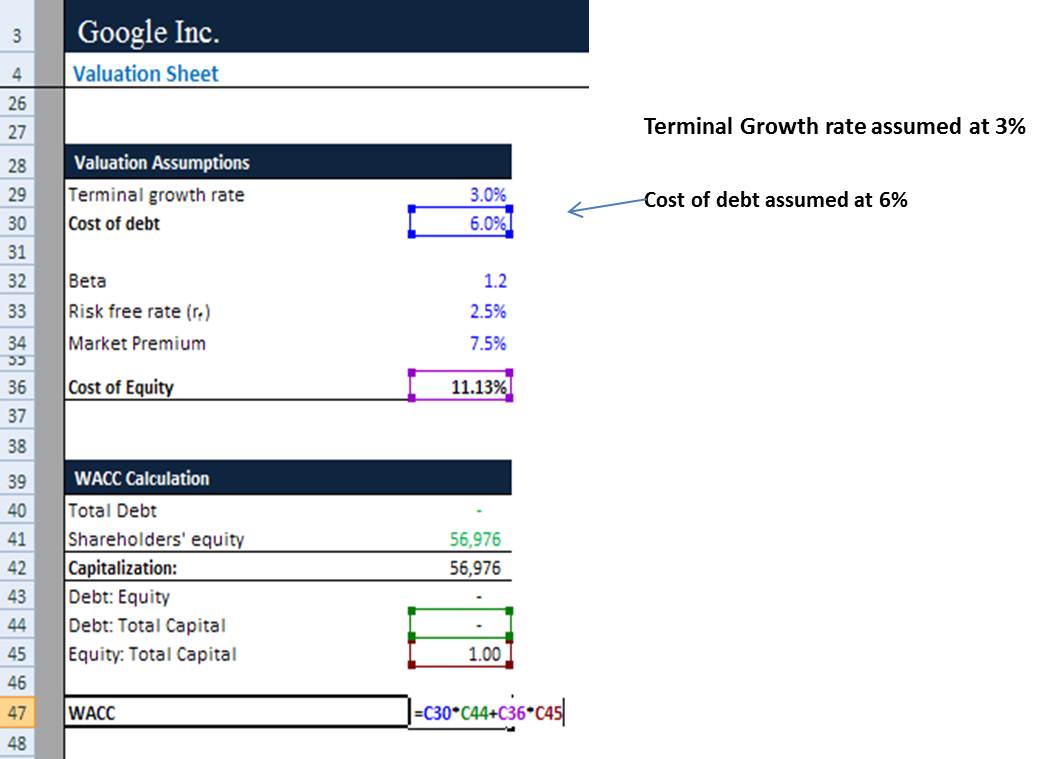
Step 2: Calculate the WACC (Weighted Average Cost of Capital) Terminal value DCF
In the second step, we must calculate the cost incurred on working capital.
![]()
Where:
Re = Cost of equity
Rd = Cost of debt
E = Market value of the firm’s equity
D = Market value of the firm’s debt
V = E + D (Total Capital Value)
E/V = Equity Proportion to the total capital
D/V = Debt Proportion to the total capital
Tc = Corporate tax rate
From the above formula, we need to calculate the cost of equity and the cost of debt.
We will calculate the cost of equity by using the CAPM formula.
CAPM= Rf + Beta (Rm – Rf)
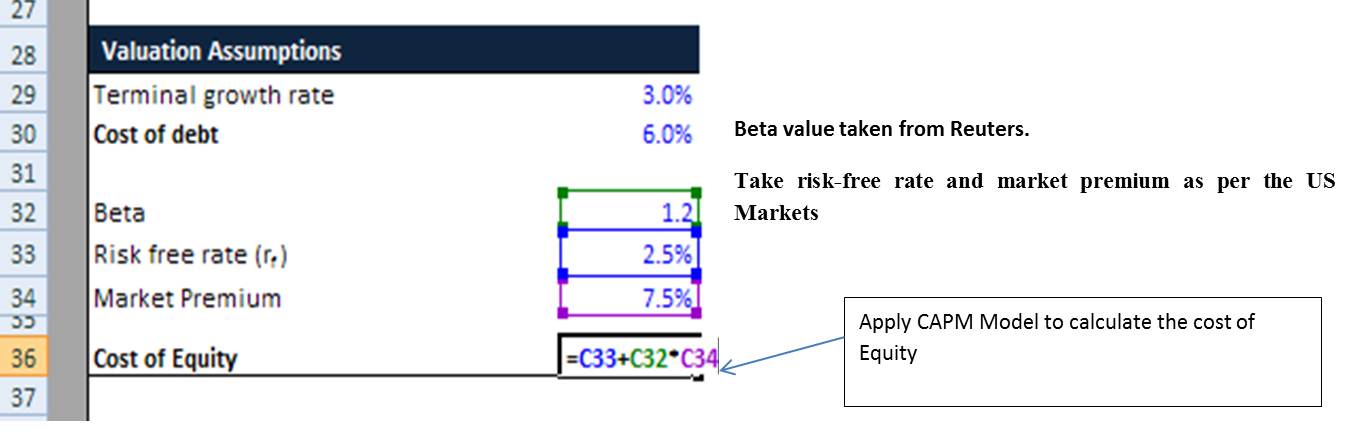
Next, we will calculate WACC as the cost of debt in this case.
Step 3: Estimate the Terminal Value in DCF
As discussed above, we can apply the formula and calculate the terminal value.
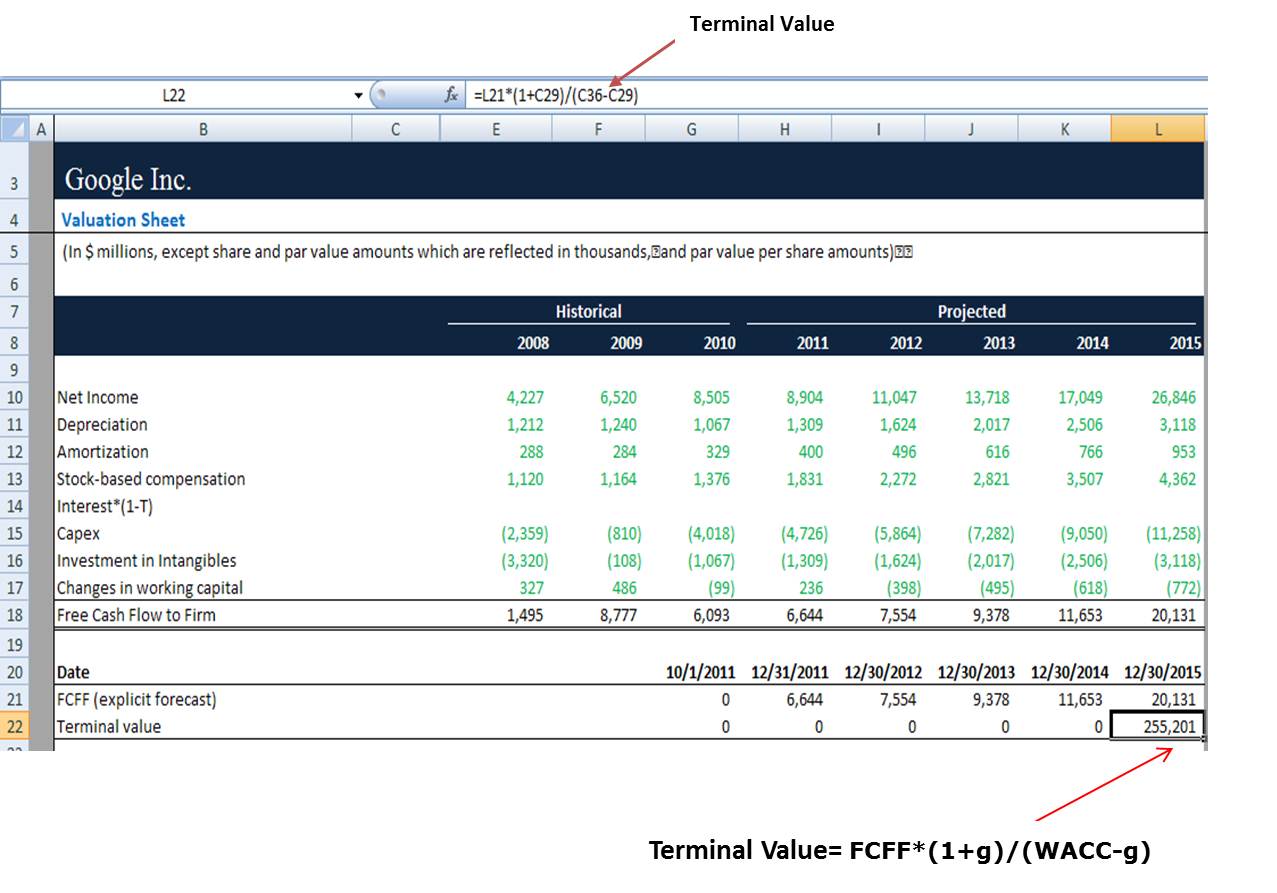
Here, we have to link FCFF value starting from the forecasted year. Hence, it is called an explicit forecast.
Step 4: Discount FCFF
In the following step, we calculate the Present value of an explicit forecast period using the Excel function XNPV.
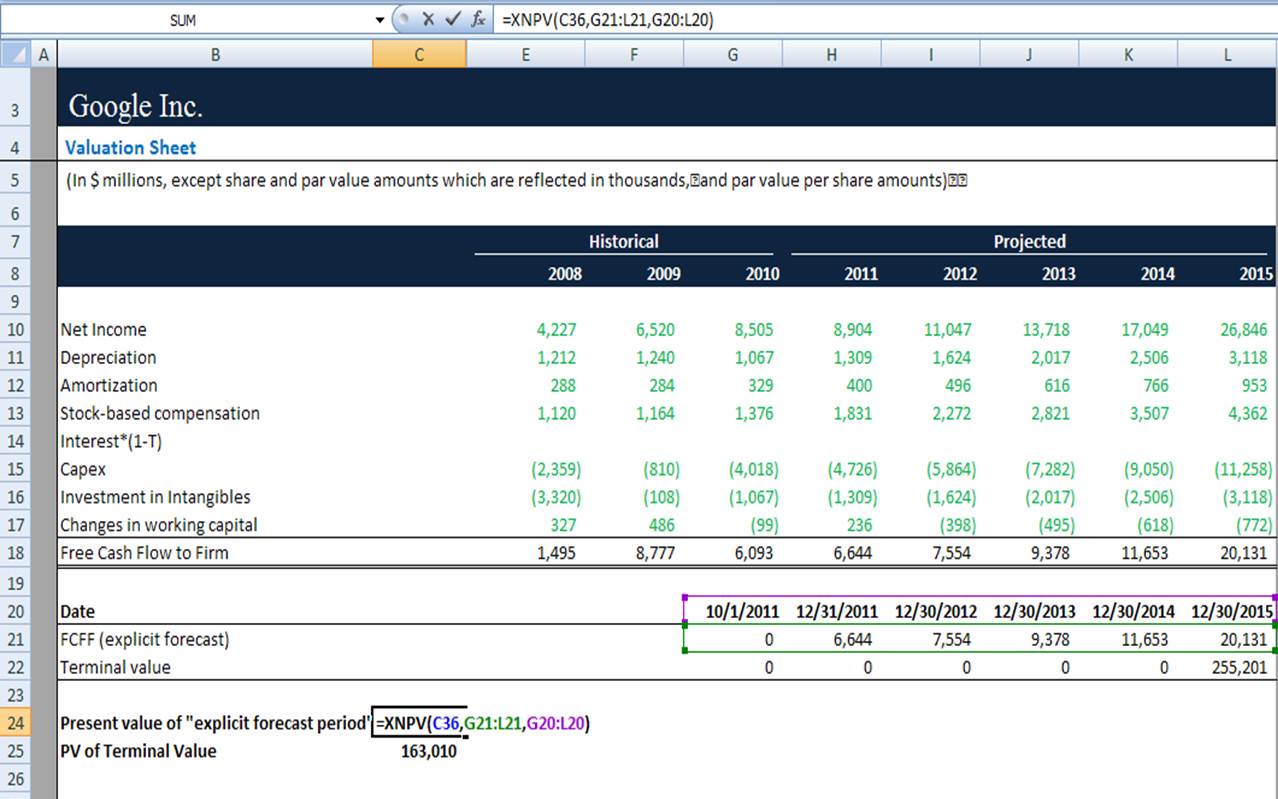
XNPV(rate, values, dates)
Where,
Rate= Discount rate applied to cash flows.
Values=A series of cash flow
Dates= Schedule of payment date.
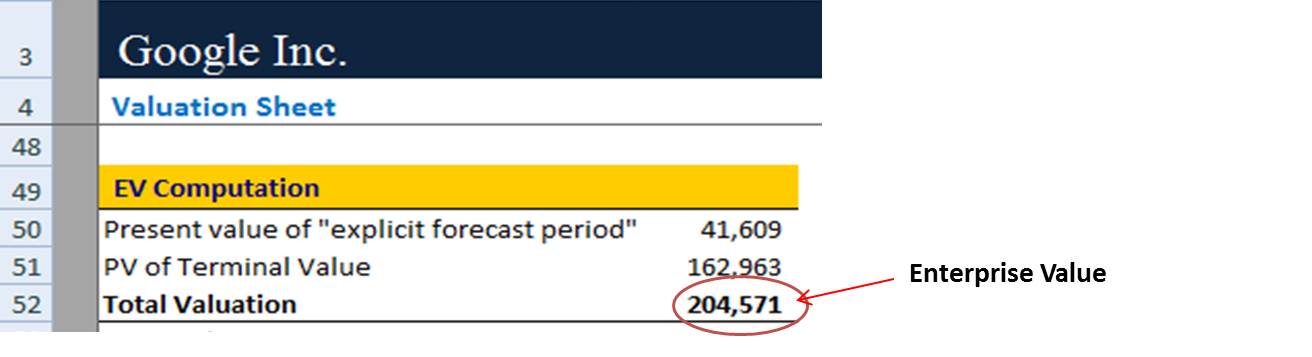
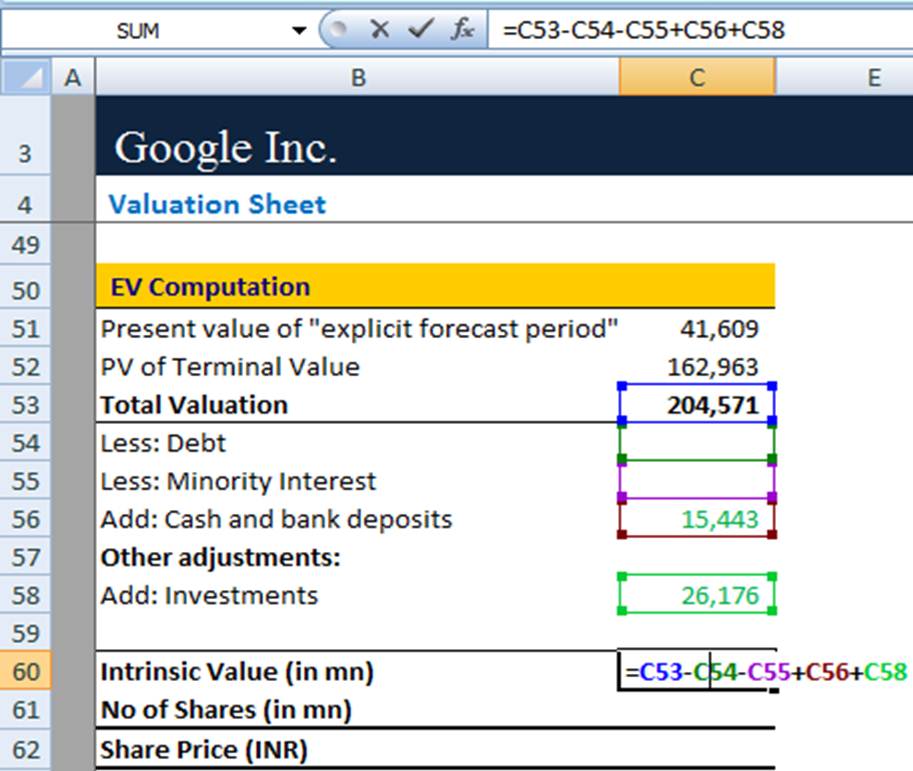
Step 6: Find the Enterprise Value
In this step, we will calculate the total enterprise value by summation of the present value of the explicit forecast period and the present value of the terminal value.
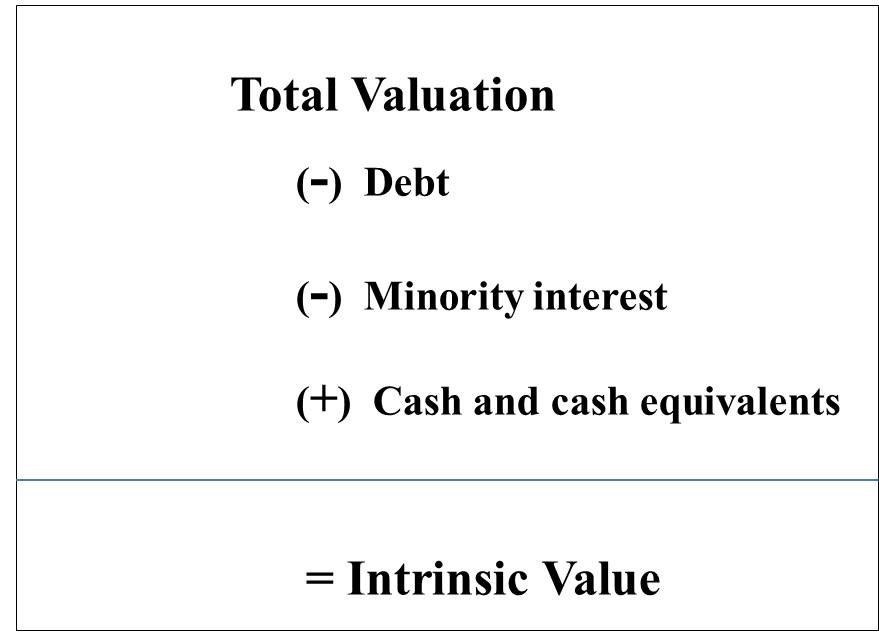
Step 7: Adjust Enterprise Value to arrive at Equity Value
In this step, we have to find out the intrinsic value of the firms, as shown below.
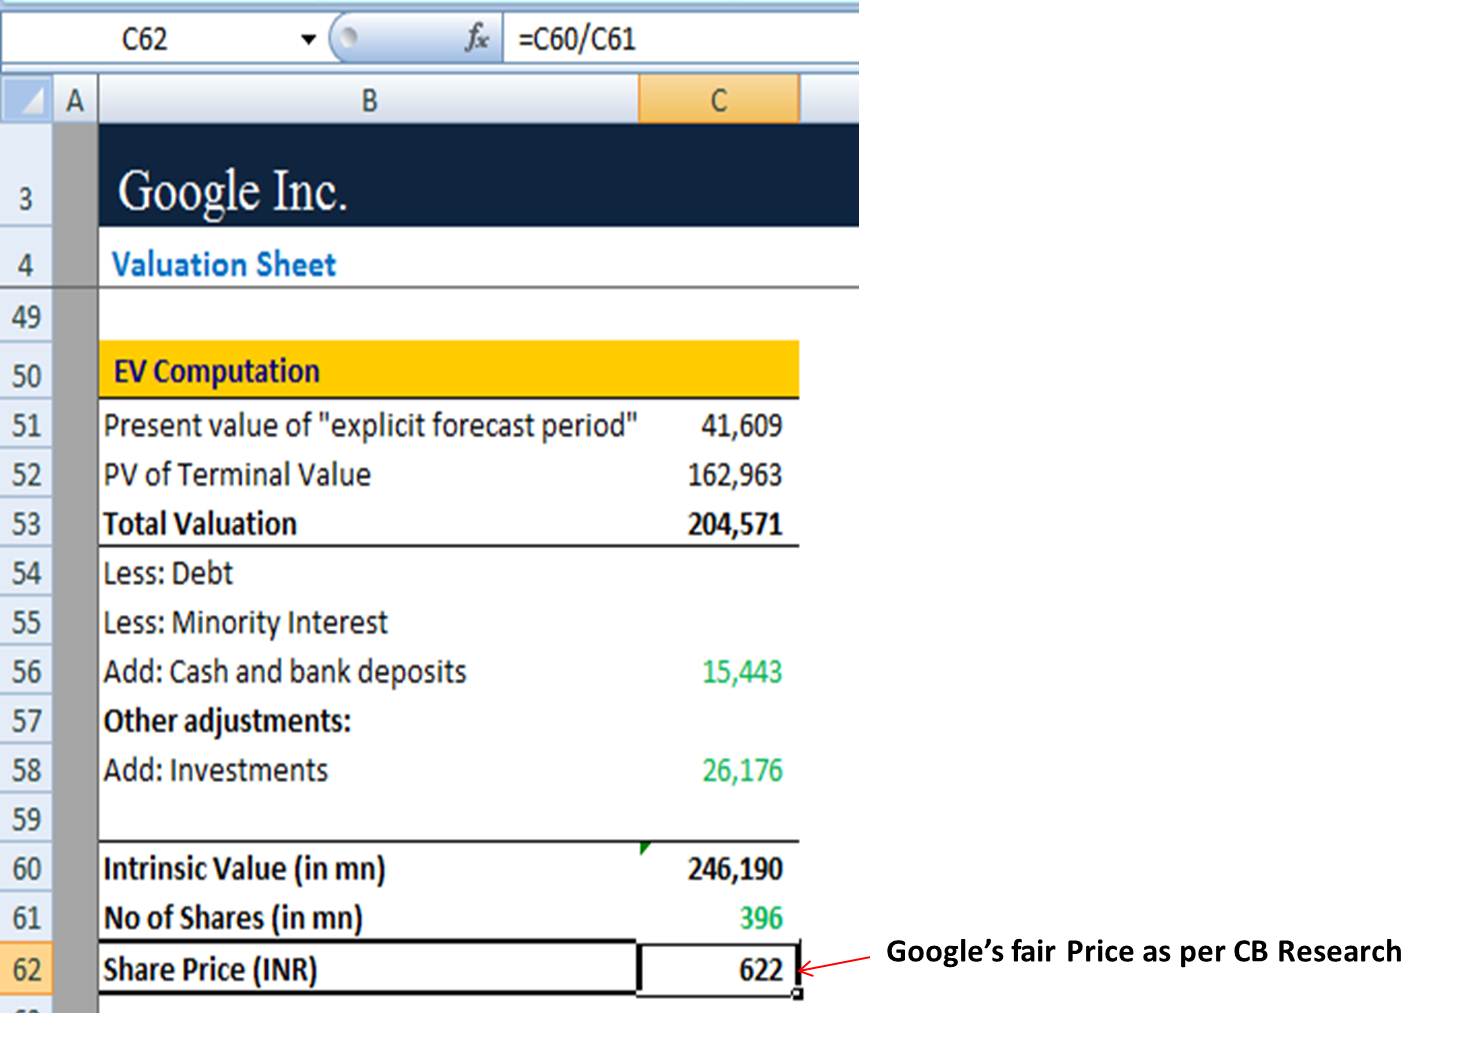
Step 8: Find the fair Price of Google Share
We can easily find the fair price of Google’s shares by dividing the intrinsic value by the total number of shares.
Thus, by applying the same technique, we can find out the share price of any organization. If the calculated share price comes out to be more than the current market price, the recommendation will be to BUY that share, and the company is said to be undervalued. In other cases, if the calculated fair price of the share is less than the current market price, then the recommendation will be to SELL that share, and the company is said to be overvalued.
Terminal Multiple Method
This is another way of determining the terminal value of cash flows. It assumes that the company will be valued based on public market valuations at the end of the projection period. It is calculated using a multiplier of some income or cash flow measures such as EBITDA (Earnings Before Interest Depreciation Amortization) and EBIT (Earnings Before Interest Tax).
Multiple should reflect the ongoing growth potential of the business. It should be based on the appropriate multiple used in that particular industry (EBITDA/EBIT/EBITDA)
E.g. 10x EBITDA
8.5x EBIT
There are some variations of multiple users in the multiple terminal approaches:
- P/E Multiple: P/E multiple is calculated as market price per share divided by earnings per share, indicating investors are willing to pay for the company’s earnings.
- Market-to-book multiple: Compares a stock’s market price to its book value. Market to book multiple indicates how much shareholders pay for a company’s net assets.
- Price to Revenue multiple: It indicates the company’s stock price value to its revenue. It indicates the value placed on each dollar of the company’s revenue or sales.
Here we need to know:
- Multiple is derived from the valuation of comparable companies.
- Normalized multiples should be used.
- Multiple should reflect the long-term market valuation of the company rather than a current multiple that may be distorted by industry or economic cycle.
- It is also very important to do sensitivity analysis on multiple.
For Example:
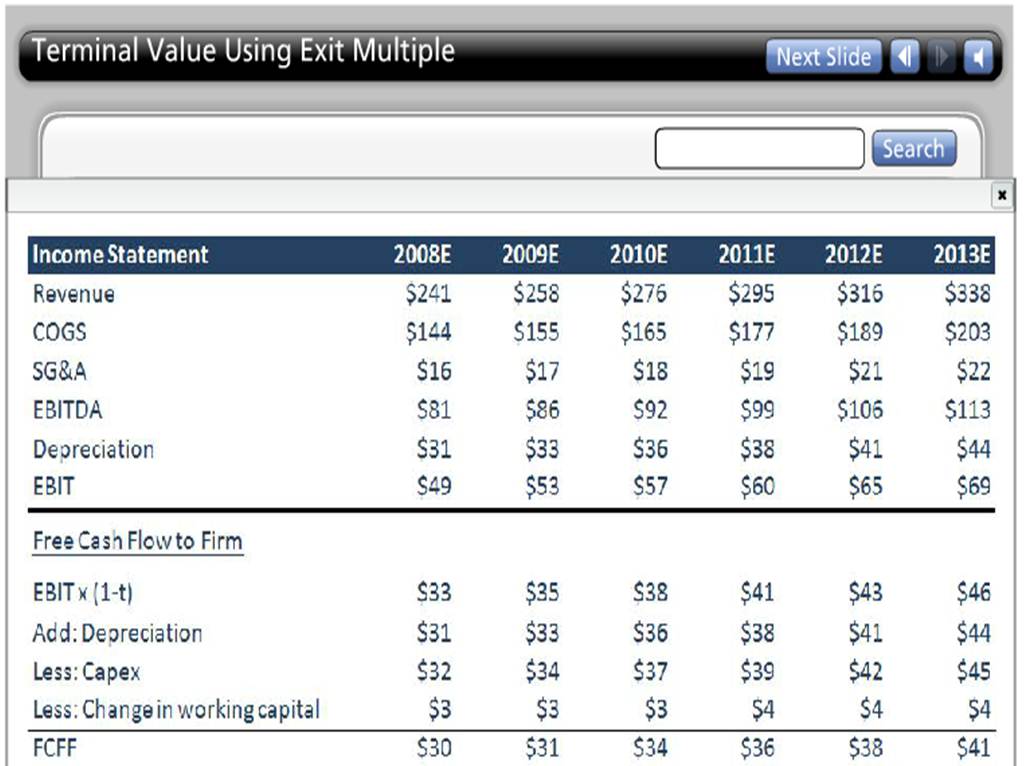
In the above example, the EBITDA expected for the year 2013 is $113 Million, and the EBITDA transaction multiple is 7x,
Then,
Terminal Value= EBITDA (2013)* Multiple
=$113*7
=$791 Million
Using multiples in valuation has certain advantages, like ease of use, as it is based on market values and provides a useful estimation stage. However the disadvantage lies in finding comparable values in the industry, as the firms may differ to a greater extent.
DCF is the most common method of valuation. It is forward-looking and relies on fundamental expectations.
The accuracy of DCF valuation depends upon the quality of the assumptions, with the factors FCF, TV, and discount rate. The inputs in valuation are from various resources and must be viewed factually.
Terminal value represents a high percentage of the DCF valuation. In the future, there can be fluctuations in real-time values, which may cause an increase or decrease in actual terminal value. So, risk is the factor that should be taken care of.
Recommended Articles
We hope this EDUCBA information on “Terminal Value in DCF” benefited you. You can view EDUCBA’s recommended articles for more information,
