Definition of Sensitivity Analysis
It is a situation similar to “what-if” analysis or simulation analysis. It is used to predict the outcome of a decision based on a certain range of variables.
It is especially useful in cases where investors and stakeholders evaluate the projects and proposals from the same industry or from different industries but driven by similar factors.
Uses of Sensitivity Analysis
Here we discuss the uses of sensitivity analysis:
- Developing Recommendations for the Decision-makers
- Feasibility testing of an optimal solution
- Identifying the sensitive variables
- Identifying critical values and break-even point where the optimal strategy changes
- Assessing the degree of risk involved in strategy or scenario
- Communication
- Allows the decision-makers to make assumptions
- Making recommendations
- Quantifying the parameters
- Developing a hypothesis for testing different scenarios
- Estimating the requirements of the input and output variables
- Understanding the relationship between input variables and the outcome
Forms of Outcomes in Sensitivity Analysis:
- Pessimistic
- Expected or the Original
- Optimistic
Examples of Sensitivity Analysis (With Excel Template)
Let’s take an example to understand the calculation of Sensitivity Analysis in a better manner.
Sensitivity Analysis – Example #1
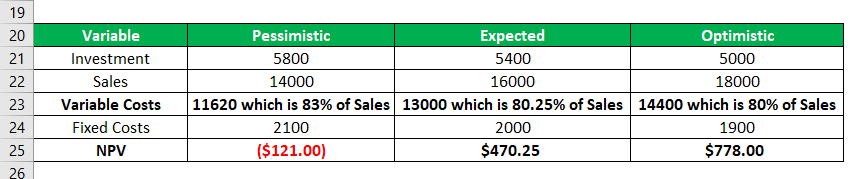
The expected Cash Flow forecast for the next 12 years is provided (see below). The cost of capital is 8 %, assuming the variables remain constant and determine the project’s Net Present Value (NPV). More details of the calculation are in the attached Excel sheet.
Explanation
Sensitivity Analysis determines the impact of a change in the outcome with the inputs’ various projected changes.
- Develop the forecasted income statement.
- Determine the fixed costs and the variable costs by analyzing all the costs involved in the process
- Determine the range of Sales Factors percentages
- Increase and decrease the sales volume based on the various Sales Percentage factors
- Increase and decrease the Variable costs based on the various Sales Percentage factors
- The Fixed costs remain constant irrespective of the sales volume and change to it.
- Determine the Net Income Before Taxes for the various sales volume. This can be arrived at by simply reducing the sales by variable and fixed costs aligned to it.
- Determine the Net Income After Taxes by applying the Tax Rate as applicable
Sensitivity Analysis – Example #2
Example of J&B Inc. The original or expected Sales Volume is $582,401 arising out of 7882 units and at $73.89.To conduct the sensitivity analysis – J&B Inc conducted two models with different input variables for the Pessimistic Model and the Optimistic Model, as seen highlighted below:
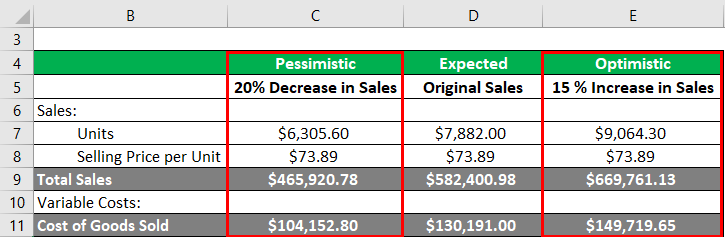
Based on these pessimistic and optimistic values of the sales and variable costs, the net income after taxes can be seen as varying. Hence, on creating the two models, we aim to arrive at a conclusion or analysis of the input factors to reach the desired Net Income figures.
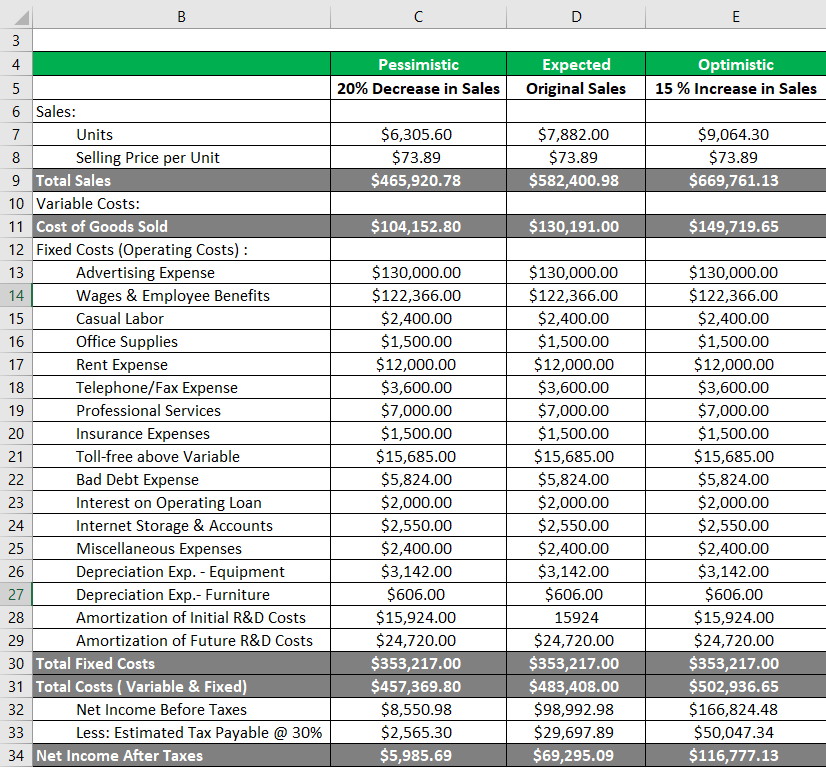
The estimation of sales and, therefore, the variable costs help decide and greatly impacts the NPV of given projects. The fixed costs and any changes to them become insignificant but remain constant across different sales volume levels.
Relevance and Use
As per the requirement of the decision-making area, the variables and their types would differ. Accordingly, the parameters are decided, and the sensitivity analysis is conducted. Sensitivity Analysis, among other models, is put much more to use as a decision support model than merely a tool to reach one optimal solution. However, this form of analysis becomes ambiguous when the terms “pessimistic” and “optimistic” become subjective to the user and the levels considered are set as per the user.
The uncertainty of the output due to the different sources of inputs and their uncertainty results in uncertain analysis. This, in turn, leads to the quantification of uncertainty, and therefore, the need to run the sensitivity analysis comes into the picture. This is a method, again, to re-calculate the output based on different alternative assumptions. The common areas of application of the models of sensitivity analysis are:
- Business: In resource allocation, guide the future data flows, identify critical assumptions
- Environmental: Impact of water purifying plant, global climate models
- Social Sciences: Econometric Models
- Engineering: Testing designs
- Chemistry: Measurement positions
- Meta-Analysis: To check whether the results are sensitive to the restrictions, including Time-critical decision-making.
- Multiple: Criteria decision making – Selecting the best alternative from the pool of the different available alternatives
Recommended Articles
This is a guide to Sensitivity Analysis. Here we discuss how to calculate sensitivity analysis along with practical examples. We also provide a downloadable Excel template. You may also look at the following articles to learn more –

