Updated July 6, 2023
Introduction to Tableau Dimension vs Measure
Dimension and measure play an important role in tableau visualization. When we import any kind of data from any format, it gets separated into two major factors that are dimension and measure. Dimension is the qualitative information of the data, and Measure is the quantity of the data. Let is string-like location, country, the date is the dimension of the data. Data that contains numbers like profit, a discount is a measure of the data. We can import data into Tableau either online or offline.
While importing data online, if we change the value in the database, then the dimension and measure value also changes in Tableau.
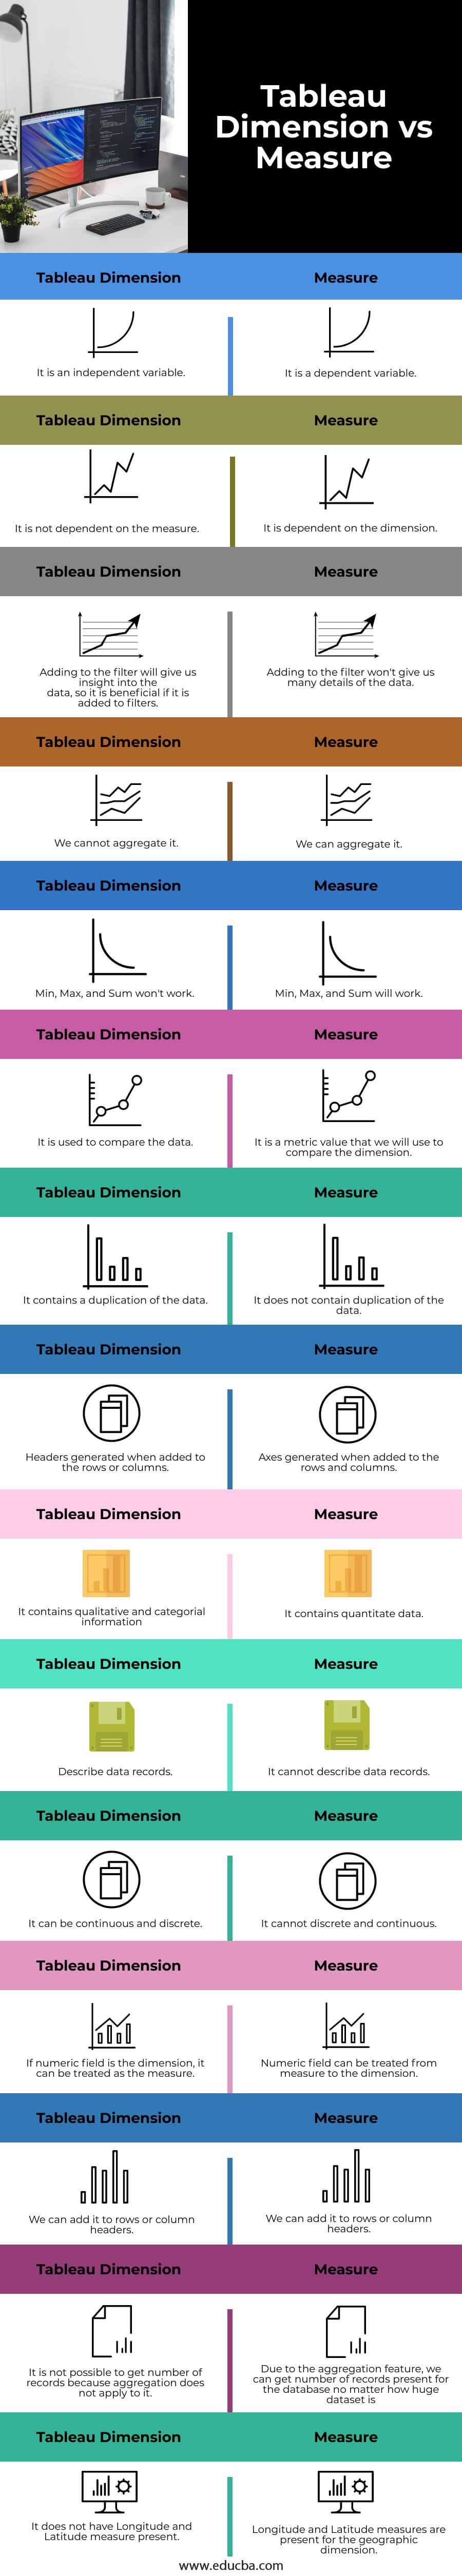
Head to Head Comparison between Tableau Dimension vs Measure (Infographics)
Below are the top 9 differences between Tableau Dimension vs Measure:
Key Difference of Tableau Dimension vs Measure Dimension
- We can watch through our data with the help of a dimension.
- It is an independent variable. (variable is memory storage for the data).
- It can be any information, such as qualitative or categorical information.
- Let’s take an example of a sample super store database; if we try to display profit for each data, we need a state as a dimension. As mentioned earlier state is the independent variable
- The major point to remember is we can not sum the dimension of the data, such as state, ID, category,
- It can be a continuous or discrete value. Boolean values such as true and false, and strings such as name can be the discrete
- Date dimension we can change the data type to date, string or
- The filter can be done for the county, region, or string data
Measures
- Measure name itself brief about it; we can measure our data because it contains the numeric value which will help us to identify data
- It is a dependent variable in the tableau; it is dependent on the
- If data or fields contain a numeric value, then it is treated as the
- It can be any value such as profit, discount or sales, etc.
- Let’s take an example of a sample superstore database; if we try to display profit for each state, we need a profit as a measure. As mentioned earlier, profit is the dependent variable here. Profit alone can not give much information that is the reason it is dependent on the state
- We can SUM, AGGREGATE, MIN or MAX, etc of the measure because it contains a numeric
- We can perform continuous and discrete operations for the aggregation of the
- If it is converted to a string, then default aggregation is
- We can perform filtering for the number data type; it varies for the range of the values, at least or at
Comparison Table of Tableau Dimension vs Measure
| Dimension | Measure |
| It is an independent variable | It is a dependent variable |
| It is not dependent on the measure | It is dependent on the dimension |
| Adding to the filter will give us insight into the
data, so it is beneficial if it is added to filters. |
Adding to the filter won’t give us many details of the data. |
| We cannot aggregate it. | We can aggregate it. |
| Min, Max, and Sum won’t work. | Min, Max, and Sum will work. |
| It is used to compare the data. | It is a metric value that we will use to compare the dimension. |
| It contains a duplication of the data. | It does not contain duplication of the data. |
| Headers are generated when added to the rows or
columns. |
Axes generated when added to the rows and
columns. |
| It contains qualitative and categorial
information |
It contains quantitative data. |
| Describe data records. | It cannot describe data records. |
| It can be continuous and discrete. | It cannot be discrete and continuous. |
| If the numeric field is the dimension, it can be treated as the measure. | The numeric field can be treated from measure to dimension. |
| We can add it to rows or column headers. | We can add it to rows or column headers. |
| It is not possible to get a number of records because aggregation does not apply to it. | Due to the aggregation feature, we can get the number of records present for the database no matter how huge the dataset is |
| It does not have Longitude and Latitude measures present. | Longitude and Latitude measures are present for the geographic dimension. |
Conclusion
Dimension and Measures are the key points of the data visualization in the tableau. It plays a major role while driving with the data or playing with the data. Data changes as per the user’s requirement. We can handle data online or offline; it will help the user to drive output as per their wish. We can have data imported from Excel, Text, JSON, PDF, etc files. We can import data from the server. We need to connect to the server with the server id or database link.
Recommended Articles
This is a guide to the top difference between Tableau Dimension vs Measure. Here we discuss the key differences between infographics and the comparison table. You may also have a look at the following articles to learn more –
