Updated May 5, 2023
Differences Between Tableau vs QlikView
Tableau can enable the user to develop dashboards instantly. It has an intuitive interface and provides greater visual freedom that differentiates itself from other players in the market. On the other hand, QlikView can deal with varied datasets and provides much better performance. It can efficiently deal with big and traditional data, and it is apt to make interconnections between datasets like these effectively. A plethora of tools is available for the end-users in the market, with Tableau and QlikView leading the foray.
Head-to-Head Comparison Between Tableau and QlikView Comparison Table
Below is the Top 6 comparison between Tableau and QlikView:
Key Differences Between Tableau and QlikView
Below are the lists of points that describe the key Differences Between Tableau and QlikView:
- QlikView is a dashboard application providing holistic and varied features, while Tableau focuses on visual analytics.
- The feature-rich QlikView is often deemed challenging to start initially compared to Tableau, which is beginner-friendly.
- Tableau provides a cleaner interface with a slightly better user experience than QlikView, whose Interface is more clutter-some. QlikView released “QlikSense,” a much neater data visualization tool to compete with Tableau.
- Tableau is considered more user-friendly because of its easy drag-and-drop capabilities.
- QlikView gives better performance because of its patented “Associative Technology,” which allows for in-memory processing of the table and, at the same time, circumvents the use of OLAP Cubing.
- Tableau has mastered the art of using diverse graphical interfaces, and hence compared to QlikView, Tableau is preferred if there are Geographical Maps, tree maps, and Overlaps in your visualizations.
- Even though Tableau has the advantages of being more user-friendly and having better visualization capabilities, it falls short when segmenting reports based on specific business criteria. While Tableau lacks a feature to provide a business-wise view, QlikView has fantastic features to generate full-fledged enterprise-scale reporting.
- Another exciting feature of Tableau is the seamless shareability of the reports over Tableau Online or Tableau Server. While QlikView doesn’t have these features on the same scale, it offers tight integration with Social Media platforms and mobile technology.
Tableau and QlikView Comparison Table
Below are the points lists describing the differences between Tableau and QlikView.
| Basis For Comparison | Board | QlikView |
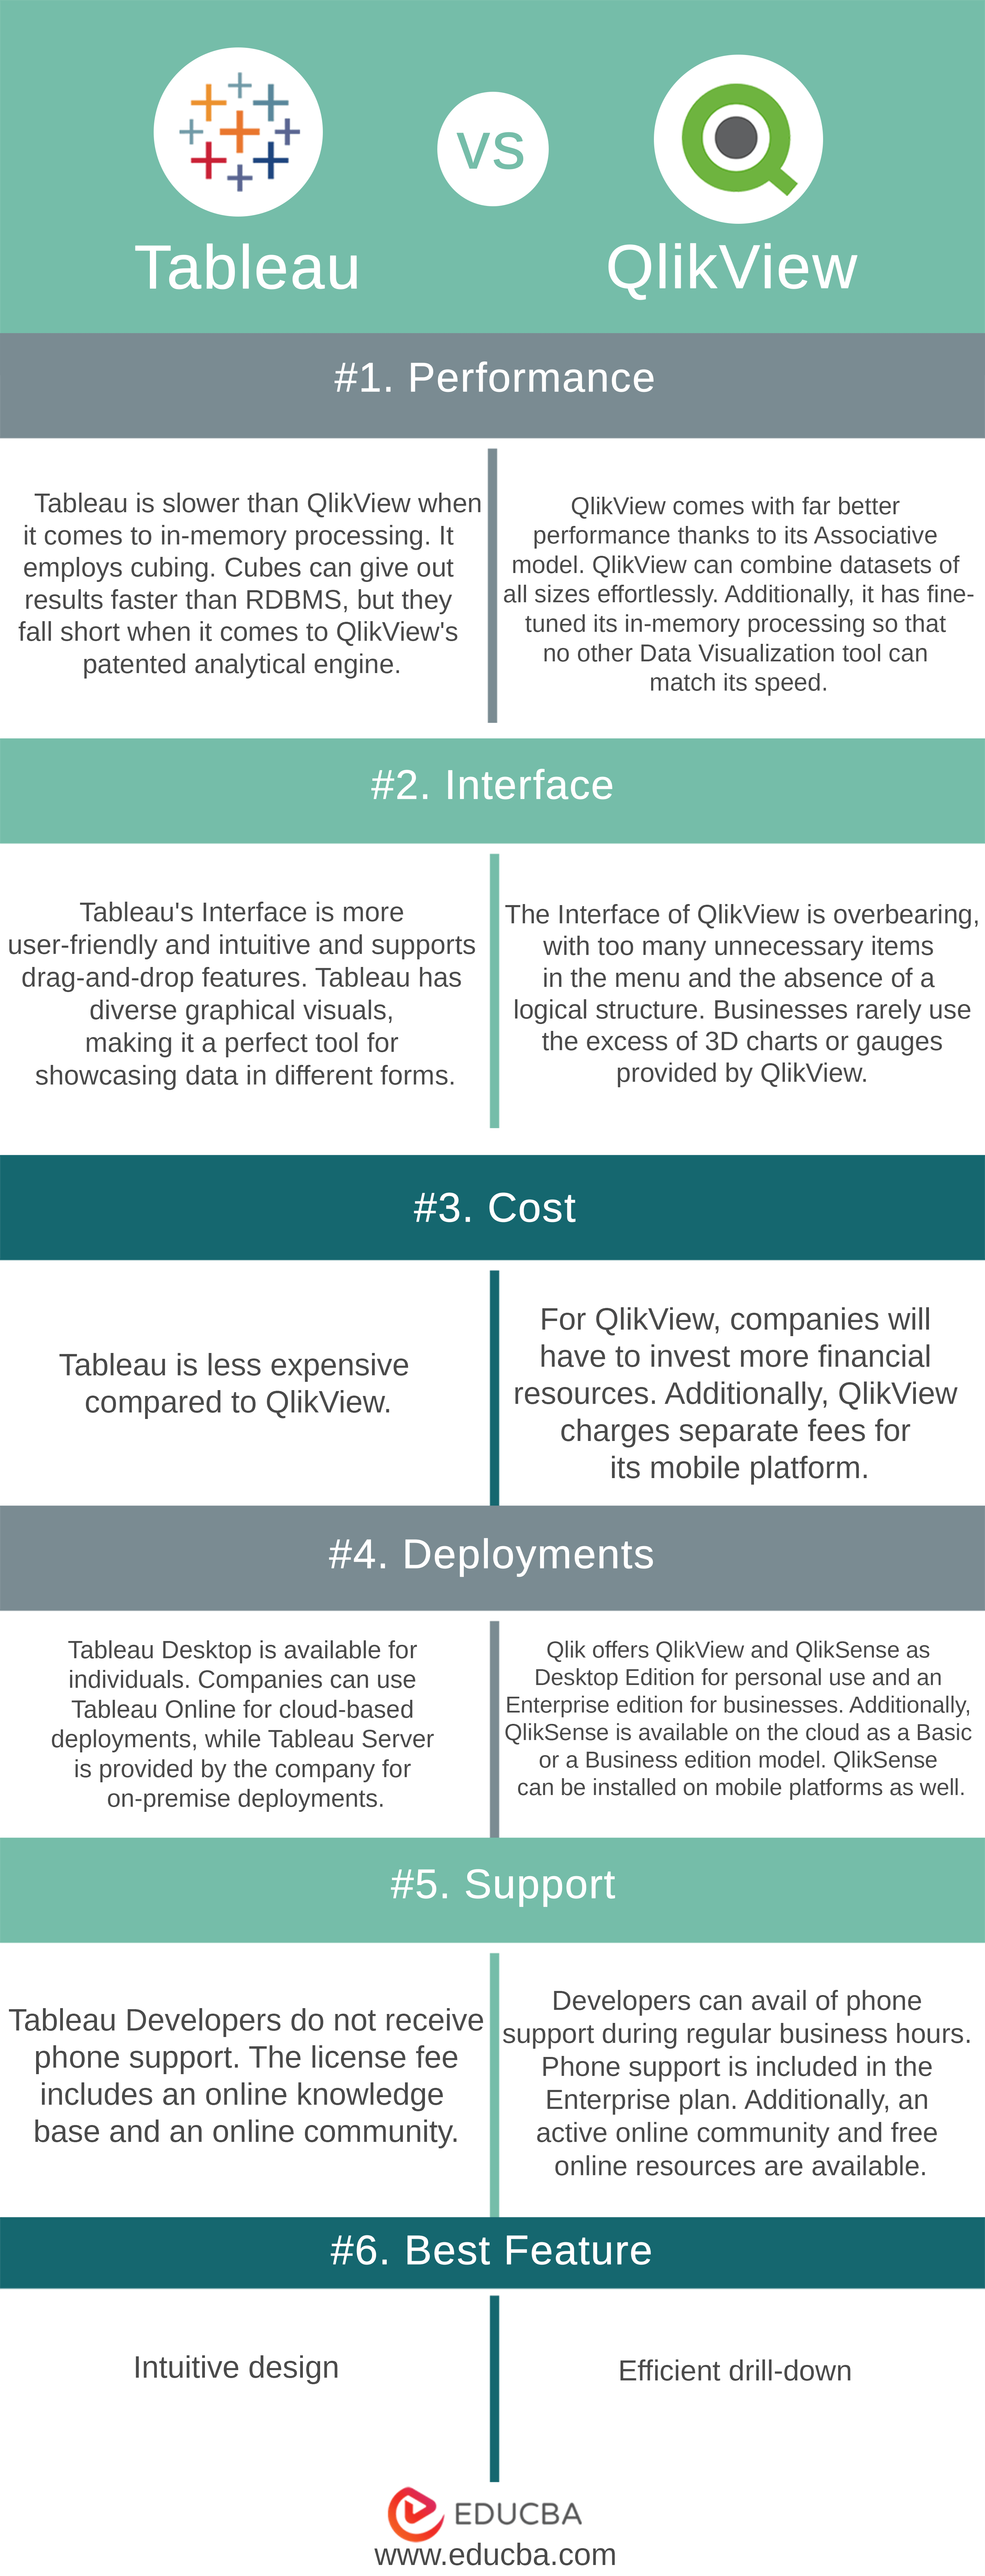
| Performance | Tableau is slower than QlikView when it comes to in-memory processing. It employs cubing. Cubes can give out results faster than RDBMS, but they fall short when it comes to QlikView’s patented analytical engine. | QlikView comes with far better performance thanks to its Associative model. QlikView can combine datasets of all sizes effortlessly. Additionally, it has fine-tuned its in-memory processing so that no other Data Visualization tool can match its speed. |
| Interface | Tableau’s Interface is more user-friendly and intuitive and supports drag-and-drop features. Tableau has diverse graphical visuals, making it a perfect tool for showcasing data in different forms. | The Interface of QlikView is overbearing, with too many unnecessary items in the menu and the absence of a logical structure. Businesses rarely use the excess of 3D charts or gauges provided by QlikView. |
| Cost | Tableau is less expensive compared to QlikView. | For QlikView, companies will have to invest more financial resources. Additionally, QlikView charges separate fees for its mobile platform. |
| Deployments | Tableau Desktop is available for individuals. Companies can use Tableau Online for cloud-based deployments, while Tableau Server is provided by the company for on-premise deployments. | Qlik offers QlikView and QlikSense as Desktop Edition for personal use and an Enterprise edition for businesses. Additionally, QlikSense is available on the cloud as a Basic or a Business edition model. QlikSense can be installed on mobile platforms as well. |
| Support | Tableau Developers do not receive phone support. The license fee includes an online knowledge base and an online community. | Developers can avail of phone support during regular business hours. Phone support is included in the Enterprise plan. Additionally, an active online community and free online resources are available. |
| Best Feature | Intuitive design | Efficient drill-down |
Conclusion
To summarize, Tableau vs QlikView bestows their unique flavors to the users. While Tableau and QlikView are utilized extensively for data visualizations, their specific differences set them apart.
This reading compares the two most popular Data Visualization tools in a thorough yet enjoyable way. Both Tableau and QlikView tools offer excellent BI capabilities to publish stunning yet insightful reports, including interactive visual analytics. Additionally, both Tableau and QlikView provide seamless integration with various data sources ranging from MS-SQL to Hadoop. However, some elementary differences exist between Tableau and QlikView, making them more suitable for a specific type of use case.
Whether you are beginning your career as a UI/UX Developer or an experienced IT professional moving to Data Analytics or Business Intelligence, knowledge of either of these technologies is fantastic. Thankfully, there are excellent courses available on the EduCBA platform which can accelerate your learning goals. Do check the links below for additional information.
For Tableau: https://www.educba.com/data-science/courses/tableau-training/
Recommended Articles
This has been a guide to the Differences Between Tableau vs QlikView.Here we have discussed their head-to-head comparison, key differences, infographics, and comparison table. You may also look at the following articles to learn more –
