Updated July 29, 2023
Portfolio Variance Formula (Table of Contents)
Portfolio Variance Formula
Portfolio variance is a measure of dispersion of returns of a portfolio. It refers to the total returns of the portfolio over a particular period of time. The portfolio variance formula is used widely in the modern portfolio theory.
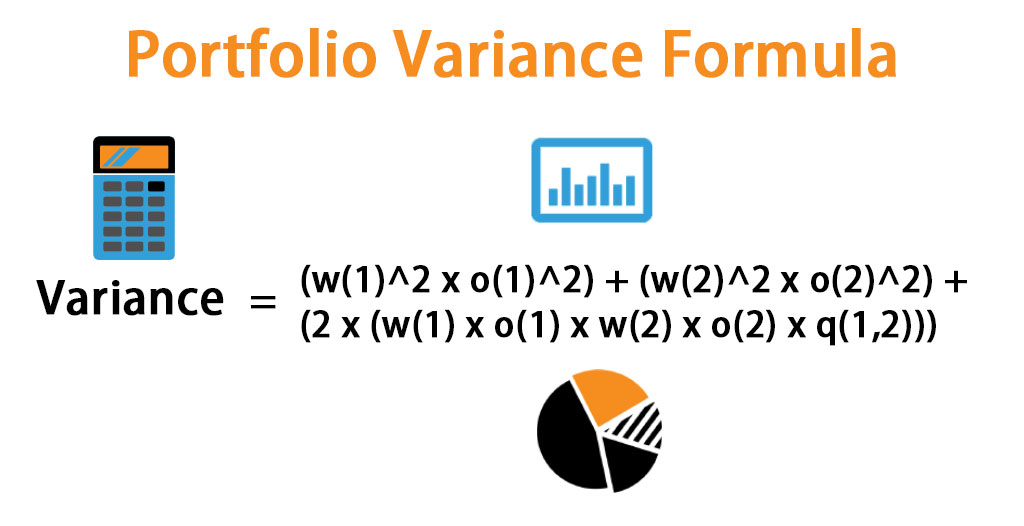
The portfolio variance formula is measured by the squaring the weights of the individual stocks in the portfolio and then multiplying it by the standard deviation of the individual assets in the portfolio and also squaring it. The numbers are then added by the covariance of the individual assets multiplied by two, also multiplied by the weights of each stock, also multiplying by a correlation between the different stocks present in the portfolio. Hence, the formula can be summarised as
Where the symbols stand for:-
- W (1): Weight of one stock in the portfolio squared.
- O (1): The standard deviation of one asset in the portfolio squared.
- W (2): Weight of second stock in the portfolio squared.
- O (2): The standard deviation of the second asset in the portfolio squared.
- Q(1,2): The correlation between the two assets in the portfolio has been denoted as q (1,2).
Examples of Portfolio Variance Formula (With Excel Template)
Let’s take an example to understand the calculation of Portfolio Variance Formula in a better manner.
Example #1
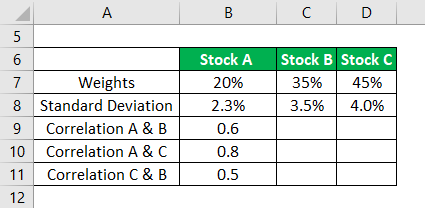
Assume stock A, stock B, stock C are real estate stocks in a portfolio having weights in the portfolio of 20%, 35% & 45% respectively. The standard deviation of the assets is 2.3%, 3.5%, and 4%. The correlation coefficient between A and B is 0.6 between A and C is 0.8 and Between B and C is 0.5.
Portfolio Variance is calculated using the formula given below
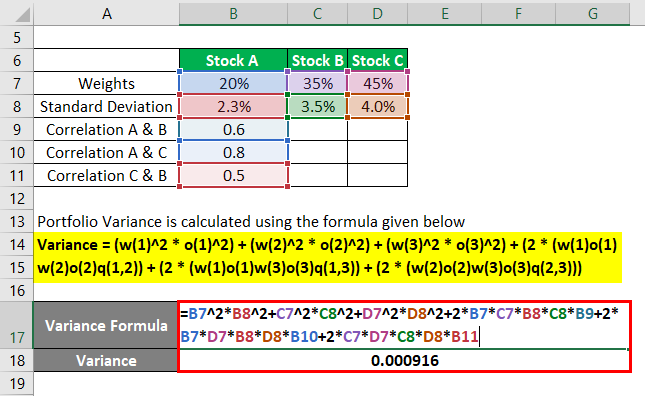
The variance of the portfolio will become
- Variance= (20%^2*2.3%^2)+(35%^2*3.5%^2)+(45%^2*4%^2)+(2*(20%*35%*2.3%*3.5*0.6))+(2*(20%*45%*2.3%*4%*0.8))+(2*(35%*45%*3.5%*4%*0.5))
- Variance = 0.000916
Example #2
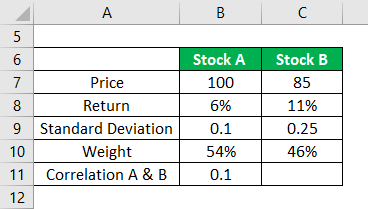
Stock A and Stock B are two real estate stock in a portfolio having a return of 6% and 11% and weight of stock A is 54% and the weight of Stock B is 46%. The standard deviation of A and B are 0.1 and 0.25. We further have information that the correlation between the two stocks is 0.1
Portfolio Variance is calculated using the formula given below
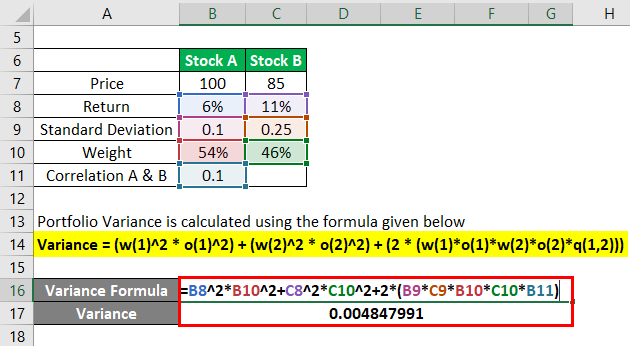
The variance of the portfolio will become
- Variance= (6%^2*54%^2)+(11%^2*46%^2) +(2*(0.1*0.25*54%*46*0.1))
- Variance = 0.004847991
Explanation
The portfolio variance formula is calculated by using the following steps:-
Step 1: First, the weight of the individual stocks present in the portfolio is being calculated by dividing the value of that particular stock by the total value of the portfolio.
Step 2: The weights after being calculated are then being squared.
Step 3: The standard deviation of the stock from the mean is then calculated by first calculating the mean of the portfolio and then subtracting the return of that individual stock from the mean return of the portfolio.
Step 4: The standard deviations of the individual stocks are calculated and squared.
Step 5: It is then multiplied by their respective weights in the portfolio.
Step 6: The correlation of the stocks present in the portfolio is being calculated by multiplying the covariance between the stocks in the portfolio with the standard deviation of the number of stocks in the portfolio.
Step 7: The formula is then multiplied by 2.
Relevance and Uses of Portfolio Variance
- Portfolio Variance formula helps the analyst to understand the variance of the portfolio and in case the analyst has benchmarked the return of their portfolio when a certain index or any other fund operating the market it can also check the variance of the same
- It is also useful in finding the correlation between the two assets. Variance tells the analyst how closely related are the stock present in the portfolio are.
- Portfolio variance is also a measure of risk, a portfolio when shows more variance from the mean signifies that the portfolio is a much riskier portfolio and need some detailed analysis into it. The variance of a portfolio can be reduced by choosing securities that are negatively correlated eg. equity and bonds.
Recommended Articles
This has been a guide to Portfolio Variance Formula. Here we discuss How to Calculate Portfolio Variance along with practical examples. We also provide downloadable excel template. You may also look at the following articles to learn more –
