Updated June 26, 2023
Introduction to Python Statistics Module
The statistics module in Python furnishes the functions for the statistical mathematics of numeric data. You can observe some popularly used statistics functions defined in this module. These modules are pretty straightforward to use.
Import statistics files use these to perform different statistical operations and calculate their results. The statistics module lets you approach simple math problems such as mean, median, mode, variance, and standard deviation. The module calculates numeric mathematical statistics for functions in Real valued data. Unless explicitly noted, these functions support float, int, fraction, and decimal.
Why are Statistics Used in Python?
R programming focuses on statistics, while Python serves general purposes and includes statistical modules. Comparatively, Python is less concerning features of statistical analysis than R language. Nonetheless, Python has a mix of statistics and building complex analysis pipelines, where it stands rich and is an invaluable asset. Sadly, the statistics module is not available in Python 2.7, but you are good to go with Python 3 if you have had to use these. Some third-party libraries like Scipy, Numpy, and a few for professional statisticians, Matlab, SAS, and Minitab. These functions excel in graphing and scientific calculations at a high level.
Modules of Python Statistics
Let us explain a few of the modules of statistical – mathematical approach in Python one by one.
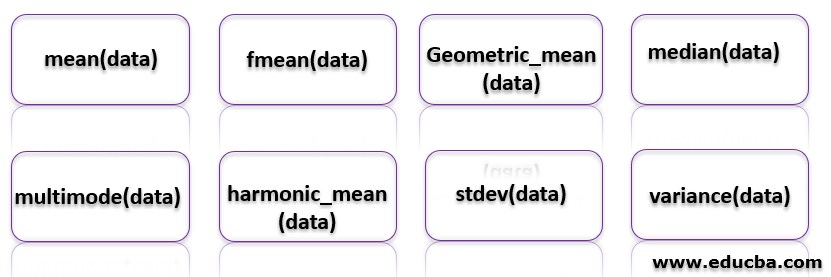
1. mean(data)
Returns arithmetic mean of sample or population for which data is a sequence or an iterable. If empty data is found, StatisticsError is raised.
2. fmean(data)
Data conversion to mean and arithmetic mean computation. A function always returns a float for which data is a sequence or an iterable. If empty data is found, StatisticsError is raised.
3. geometric_mean(data)
Computation of geometric mean by converting data to float. This function indicates the central tendency or typical value of the data. If empty data is found, StatisticsError is raised.
Example: round(geometric_mean([36, 24, 54]), 1)
4. median(data)
The median value or middle value is returned data. When the data number points are even, the median interpolates and prints by taking the average of two middle values. If the function encounters empty data, it raises a StatisticsError.
5. multimode(data)
This function returns a list of regularly occurring values. When the data is empty, the function returns an empty list. If multiple modes exist, the function returns more than one result. When the function encounters empty data, it raises a StatisticsError.
The below are new in version 3.8
6. harmonic_mean(data)
The harmonic mean of data is returned. Subcontrary mean or harmonic mean is the reciprocal of the arithmetic mean. If the function finds empty data, it raises a StatisticsError.
Example: harmonic_mean ([40, 60])
7. stdev(data)
The standard deviation of the sample is returned (sample variance square root).
8. variance(data)
The function returns the sample variance of the data as an iterable of at least two real-valued numbers. A big difference or variance indicates data spread.
Averages and Measures of Central Location
Functions in Averages and measures calculate an average value from the sample population. Whereas Measures of spread functions calculate the deviation measure of the sample or population from average or typical values.
- mean function: Average or mean of data.
- fmean function: Mean for floating point arithmetic.
- geometric_mean function: Mean of data for geometric.
- harmonic_mean function: Harmonic mean of data.
- median function: Middle value or median of data.
- median_low function: Least median of data.
- median_high function: High-end median of data.
- median_grouped function: 50th percentile of grouped data.
- mode function: The most common value of nominal or discrete data. (single mode)
- multimode function: The most common values of nominal or discrete data. (list of modes)
- qualities function: Data divided into intervals with equal probability
Spread Measures
- stdev function: Standard deviation of population data.
- pstdev function: Variance in population data.
- pvariance function: Standard deviation of sample data.
- variance function: Variance of sample data.
Example of Python Statistics Module
Some of the examples are given below:
Code:
import statistics
list_example = [6,7,2,6,3,5,5,5,2,5,6,1,2]
a = statistics.mean(list_example)
print(a)
b = statistics.median(list_example)
print(b)
c = statistics.mode(list_example)
print(c)
d = statistics.stdev(list_example)
print(d)
e = statistics.variance(list_example)
print(e)
Output:
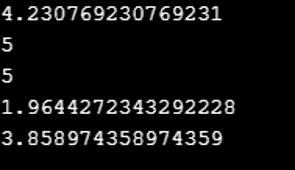
- The first line of output displays the mean. That is the average of the given list.
- The second line of output displays the median of the given list.
- The third line of output displays the mode of the given list. That is the value that frequently occurs in the given list.
- The fourth line of the list displays the standard deviation of the given list. That is the amount of variation or dispersion among the set of values in the given list.
- The fifth line of output displays the variance. How far does the set of values spread from the average value?
Exceptions and Errors in Python Statistics Module
Exceptions and errors in the Python statistics module are given below:
For the statistics-related exceptions, a subclass of ValueError. If sigma is –ve, Statistics Error is raised. You need to make sure that you use the map function to ensure a consistent result when your input consists of a mixed collection type.
Like for example, map(float, data_input).
Example #1
Code:
#For mean:
import statistics
data = [1, 5, 6, 7, 4, 5, 6]
a = statistics.mean(data)
print("Mean of the given list : ", a)
Output:

Example #2
Code:
#For median:
import statistics
data = [-8, -5, -4, -9, 0, 2, 5, 6, 1]
a = statistics.median(data)
print("Median of the given list is : " ,a)
Output:

Recommended Articles
This is a guide to Python Statistics Module. Here we discuss basic concepts, averages, and measures of central location along with modules of Python statistics. You may also look at the following articles to learn more –

