Updated June 23, 2023
Overview Of Standard Deviation in R
Standard deviation in R is a statistic that measures the amount of dispersion or variation of a set of values; generally, it is used when dealing with values where we have to find the difference between the values and the mean.
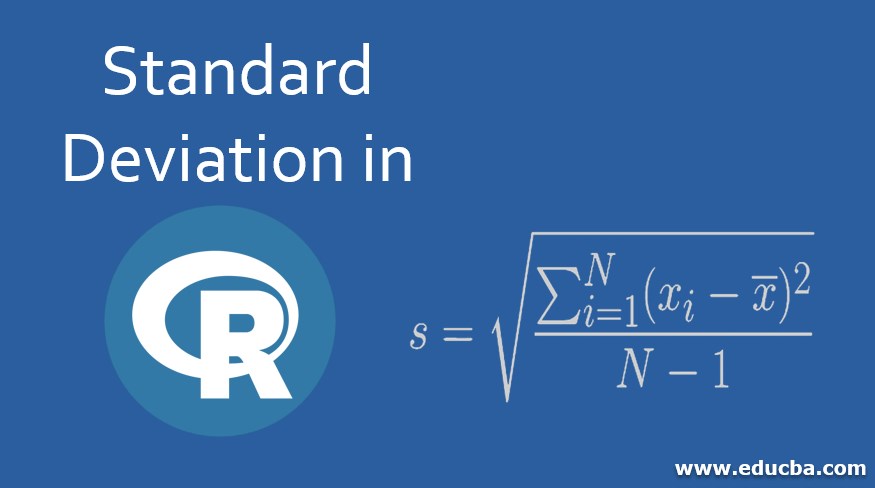
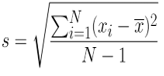
Mathematical formula of standard deviation:
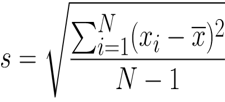
Where,
- S: Sample standard deviation.
- N: Number of observations.
- xi: Observed value of the sample item.
- x̅: Mean value of the observation.
How to Calculate Standard Deviation?
The steps to calculate Standard deviation are:
- Step 1: Calculate the mean of all the observations.
- Step 2: Then, for each observation, subtract the mean and double the value of it (Square it).
- Step 3: We got some values after deducting the mean from the observation and do the summation of all of them.
- Step 4: Divide the summation with the number of words minus 1.
You will get the standard deviation as a result after completing 4 steps.
Examples with Steps of Standard Deviation
Let’s take an example and follow these steps.
Example #1
The data set looks like this,
4,8,9,4,7,5,2,3,6,8,1,8,2,6,9,4,7,4,8,2
Step 1: Calculate the mean of all the observations,
- Mean = (4 + 8 + 9 + 4 + 7 + 5 + 2 + 3 + 6 + 8 + 1 + 8 + 2 + 6 + 9 + 4 + 7 + 4 + 8 + 2) / 20
- Mean = 107/20
- Mean = 5.35
Step 2: For each observation, subtract the mean; we will put it in tabular form for convenience,
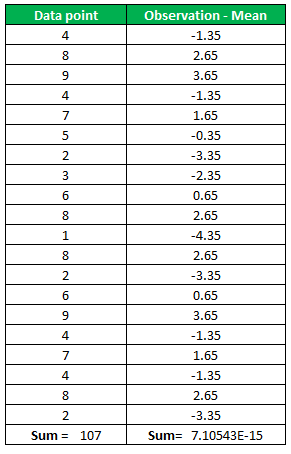
Double the value of the column second (Observation – Mean)^2.
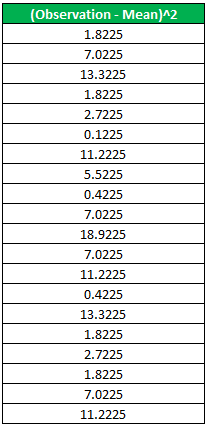
Step 3: Summation all the values present in the above column.
1.8225 + 7.0225 + 13.3225 + 1.8225 + 2.7225 + 0.1225 + 11.2225 + 5.5225 + 0.4225 + 7.0225 + 18.9225 + 7.0225 + 11.2225 + 0.4225+13.3225 + 1.8225 + 2.7225 + 1.8225 + 7.0225 + 11.2225 = 126.55
Step 4: We will calculate the Standard deviation by dividing summation by the number of observations minus 1, and we will square root the result.
Standard Deviation = (126.55/19)^0.5 = 2.58079
Example #2
Now we will look into some other examples with different datasets. In this example, we have two columns. In one column, we assigned some alphabetic codes to the people; in the next column, we have the age of those sets of people.
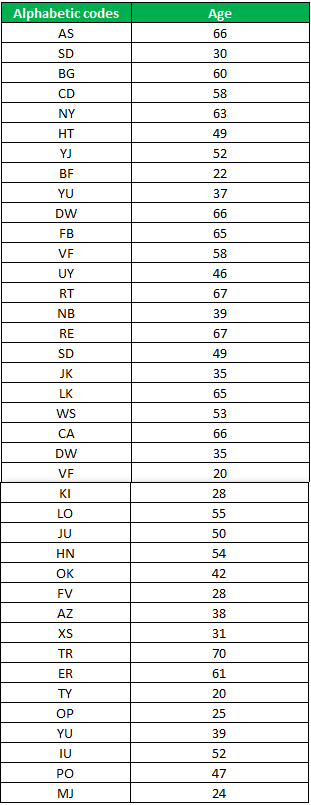
Step 1: We will upload the Excel file in R. Here, we will use the read.csv function because our Excel file is in csv format. Suppose this table is in Excel, so how this will work in Rstudio, we will discuss this step by step. The name of the Excel file is “alphabetic code.”
The function for the same looks like this,
SD_age = read.csv("alphabetic code.csv")
Step 2: Calculate the standard deviation from the Excel file. As we can see, that 2 column contains a numeric value. We will run our code on that column specifically,
In R, the syntax for Standard Deviation looks like this:
standard_deviation_age = sd(SD_age)

standard_deviation_age
The output of the codes provides us with the Standard deviation of the dataset. The standard deviation of the age is 15.52926.
Methods of Standard Deviation in R
Multiple methods exist to calculate Standard deviation in R. We will discuss one long and very short process.
1. Long Method
This method will incorporate the same steps we did earlier in this article; the only difference now is we will use R commands.
Step 1: Calculate the mean of all the observations.
Code:
dataset = c(4,8,9,4,7,5,2,3,6,8,1,8,2,6,9,4,7,4,8,2)

meandataset = mean(dataset)

meandataset
Output:
![]()
Step 2: For each observation, subtract the mean from all the observations of the dataset. For this, we will make a function in R, which will help us to find [Observation-Mean].
Code:
dataset = c(4,8,9,4,7,5,2,3,6,8,1,8,2,6,9,4,7,4,8,2)

meandataset = mean(dataset)

sumdataset = function(dataset){dataset-meandataset}

Observation_Mean = sumdataset(dataset)

Observation_Mean
Output:

The output shows Observation – Mean for all the values in our dataset. Now we will square each value of this output and do the summation.
Code:
dataset = c(4,8,9,4,7,5,2,3,6,8,1,8,2,6,9,4,7,4,8,2)>

meandataset = mean(dataset)>

sumdataset = function(dataset){dataset-meandataset}

Observation_Mean = sumdataset(dataset)

square_Observation_Mean = Observation_Mean*Observation_Mean

square_Observation_Mean
Output:
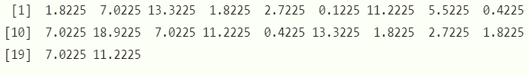
Step 3: Summation all the values present in the above column. We will add all these [(Observation – Mean)^2].
Code:
dataset = c(4,8,9,4,7,5,2,3,6,8,1,8,2,6,9,4,7,4,8,2)

meandataset = mean(dataset)

sumdataset = function(dataset){dataset-meandataset}

Observation_Mean = sumdataset(dataset)

square_Observation_Mean = Observation_Mean*Observation_Mean

sum_square_Observation_Mean = sum(square_Observation_Mean)

sum_square_Observation_Mean
Output:
![]()
Step 4: We will calculate the Standard deviation. No, we will put all the necessary information which we derive in all the above steps into this function:
- Standard deviation = (126.55/19)^0.5
- Standard Deviation = 2.58079
In R, the syntax for Standard Deviation looks like this:
Code:
dataset = c(4,8,9,4,7,5,2,3,6,8,1,8,2,6,9,4,7,4,8,2)

meandataset = mean(dataset)

sumdataset = function(dataset){dataset-meandataset}

Observation_Mean = sumdataset(dataset)

square_Observation_Mean = Observation_Mean*Observation_Mean

sum_square_Observation_Mean = sum(square_Observation_Mean)

standard_deviation = sqrt(sum_square_Observation_Mean/19)

standard_deviation
Output:
![]()
Hence we can see the Standard deviation is the same as we got earlier.
2. Short Method
Syntax in R for the direct method looks like this,
sd(x, na.rm = FALSE)
Where sd is the Standard deviation. x is those set values for which we need to find the standard deviation. na.rm, if it is true, it will remove all the missing values from the dataset/ matrix /data frames, etc. And if it is false, then it won’t remove the missing value from the data set.
Code:
dataset = c(4,8,9,4,7,5,2,3,6,8,1,8,2,6,9,4,7,4,8,2)

sd(dataset)
Output:
![]()
Conclusion
Standard deviation tells us how much our observations in the datasets are spread out from the actual mean. The significance of low and high standard deviation is:
- A high Standard deviation tells us that the numbers/observations in the dataset are more spread out.
- A low Standard deviation tells us that the numbers/observations in the dataset are less spread out, or we can say that they are close to the mean.
Recommended Articles
This is a guide to Standard Deviation in R. Here; we discuss the steps and methods of Standard Deviation in R along with examples and code implementation. You may also have a look at the following articles to learn more –
