Updated June 23, 2023

Introduction to Statistical Analysis in R
Statistical analysis is the process of applying statistical techniques and models to analyze the data to derive meaningful patterns. There are several concepts, methods, and tools available for statistical analysis. The commonly used statistical analysis techniques include identifying the data distribution on a dataset. Some statistical terminologies and symbols are used while applying statistical analysis for business and research works. Determining the mean, median, and mode of a given data set are some of the primary steps to analyzing the data. Statistical analysis is the core comment for data science projects. Specific programming languages such as R language are widely used for statistical analysis.
Statistical Analysis Using R
Statistical analysis is the initial step when analyzing the dataset. Statistics is the foundation on which data mining or any other data-related operations are carried out. R statistical analysis can be carried out with the help of a built-in function which is the essential part of the R base package. Functions such as mean, median, mode, range, sum, diff, mean, and max are a few of the built-in functions for statistical analysis in R. When working on big data; it is critical to determine the central tendency of a data set, i.e., representing the whole dataset with one value. In this article, we will look at inbuilt statistical functions like mean, median, and mode and see how they are used to determine the central tendency of a dataset.
1. Mean
The mean is calculated to determine the average of all the numerical variables in a data set. Mean can be further classified as the “Sum of all values in the collection/Total count of the values in that particular collection.”
For instance, the sample mean of the dataset of size n can be shown as:
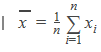
- N= Size of the data set
- X= sample mean
- Xi= numbers in the sequence
Now let’s look at the basic syntax for determining the mean in R.
syntax:
Mean(X, na.rm= False/True,…)
In the above syntax, the mean operation can be performed with the help of the mean() operator in R, X is the input vector where the data is stored, and na.rm is the function to remove the null values from the data set. By default, R has NA values in the variables. When determining the mean value, you can include multiple variables such as ‘trim’ to drop some observations from both ends of the sorted vector.
Example:
In the below example, we will create a vector named temp and then use the vector to determine the mean using the mean() function.
# Creating a vector

temp <- c(12,9,6,4.1,19, 3, 44,-23,8,-3)

# to determine the mean

result.mean <- mean(temp)

print(result.mean)
Output:
![]()
2. Median
The median is the value that defines below fifty percent of the observations. To determine the median value manually, one would require to isolate the lowest fifty percent from the highest 50 percent. The middle value is the median for data sets with odd observations. The median falls halfway between the two mid-values for data sets with an even number of observations.
Syntax:
Median(X, na.rm = FALSE)
In the above syntax, we perform a median operation using the median() operator in R. X is the input vector where we store the data, and we use the na.rm function to remove the null values from the data set. By default, R has NA values in the variables. Similar to the mean syntax, multiple further arguments for methods can be included.
Example:
x <- c(5,2,3,4,5,2,4,5,2,3,1,1,2,3,5,6) # our data set

median(x)
Output:
![]()
3. Mode
Although people rarely use it in practice, we typically include the mode as a summary statistic in discussing tools and medians. In case the selected variable has discrete values, the mode is the value that has occurred most frequently.
Syntax:
Mode(x, na.rm= False,...)
In the above syntax, we use the mode () operator to perform the mode operation, and we use na.rm to remove the null values while performing the mode operation.
Example:
#function to estimate mode

est_mode <- function(x) {

den <- density(x)

den$x[which.max(den$y)]
}

# creating a test data set

x <- c(5, 5, 6, 4, 4, 2, 3, 1, 5, 3)

est_mode(x)
Output:
![]()
Statistical Analysis on Dataset
In this section, we will look at how statistical analysis can be carried out on a dataset using R. For illustration; we will use the inbuilt dataset known as AirQuality. This dataset consists of multiple variables and includes NULL values. We shall consider one of the variables and determine the mean, median, and mode using R built-in tools.
#Determining Mean, Median, and Mode using air quality dataset.

#To return the dimension of air quality dataset

dim(airquality)
![]()
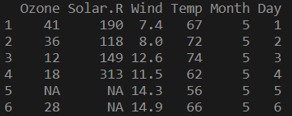
# returning top 5 rows

head(airquality)
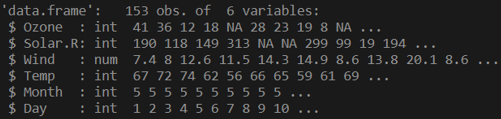
# to return the structure of the data

str(airquality)
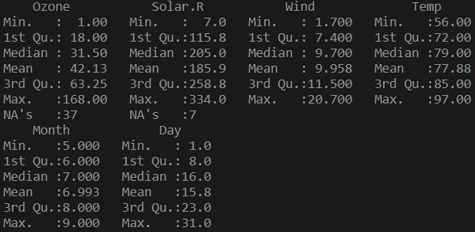
# display dataframe Summary

summary(airquality)
# Determining the mean, median and mode from the Solar variable

x <- airquality$Solar.R

x
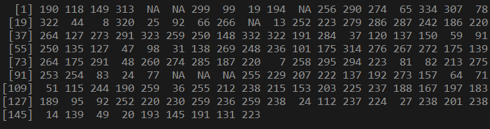
# Determining the mean, median and mode from the Solar variable

x <- airquality$Solar.R

x
![]()
# to determine mean Null values need to be removed from the variable

x <- airquality$Solar.R

mean(x, na.rm = TRUE)
![]()
# to determine the median

> x <- airquality$Solar.R

> median(x)
![]()
x <- airquality$Solar.R

median(x, na.rm = TRUE)
![]()
# to find mode

x <- airquality$Solar.R

sort(table(x))
Conclusion
This article shows how statistical analysis can be performed with R language’s built-in tools: mean, median, and mode. We have individually discussed mean, median, and mode, along with their syntax and a simple example. We have further seen running examples of performing statistical analysis on air quality datasets.
Recommended Articles
This is a guide to Statistical Analysis in R. Here, we discuss the statistical analysis using R, such as mean, median, and mode, with examples and code implementation. You may also look at the following articles to learn more-
