Updated July 24, 2023
What is the Probability Distribution Formula?
The term “probability distribution” refers to any statistical function that shows all the possible outcomes that can happen when you do something random within a given range of values.
Here, “random” could be like tossing a coin or rolling a die. Thus, probability distribution tells you the likelihood, or chance, of different events happening. Imagine you’re flipping a coin. There are two possible outcomes: heads or tails. Each outcome has a probability of 0.5, meaning there’s a 50% chance of getting heads and a 50% chance of getting tails. This is an example of a probability distribution.
There are several major categories of probability distributions, such as the Normal (or Gaussian) distribution, Chi-square distribution, Binomial distribution, and Poisson distribution.
The term “probability distribution formula” refers to the formulas used to calculate specific probability distribution parameters, such as the mean, standard deviation, skewness, and kurtosis. This article will focus on the formulas for mean and standard deviation.
Mean Formula
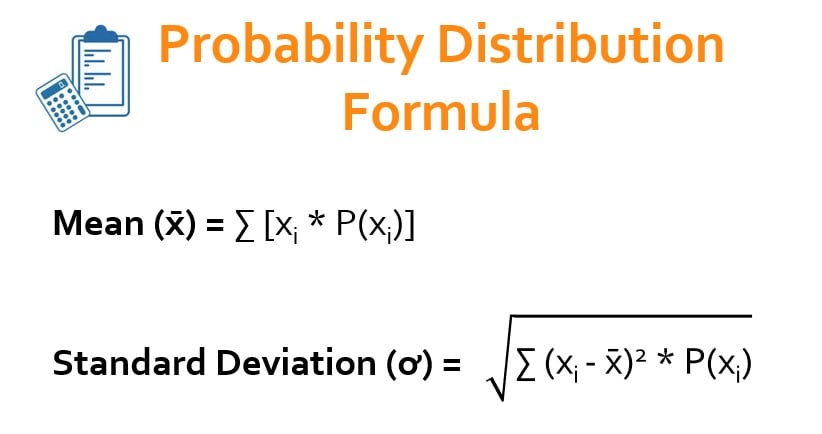
The mean is the expected value of the random variable in the probability distribution. The formula for the mean of a probability distribution is an aggregate of the products of the value of the random variable and its probability. The mathematical representation is as below:
- xi = Value of the random variable in the ith observation
- P(xi) = Probability of the ith value
Standard Deviation Formula
The standard deviation measures the variation of all the random variable values from their expected value. The formula for standard deviation is the square root of the aggregate of the product of the square of the deviation of each value from the mean and the probability of each value. The mathematical representation is as below:
Please note that the summation of all the probabilities in a probability distribution is equal to 1.
Examples of Probability Distribution Formula (With Excel Template)
Let’s take an example to understand the calculation of the Probability Distribution Formula in a better way.
Example #1
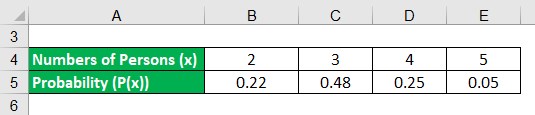
Let’s take the example of a survey conducted in a certain area to find out the expected number of persons in a family. The following data is available. Calculate the mean and standard deviation of the probability distribution.
Solution:
Mean (x̄) is calculated using the formula given below:
x̄ = ∑ [xi * P(xi)]
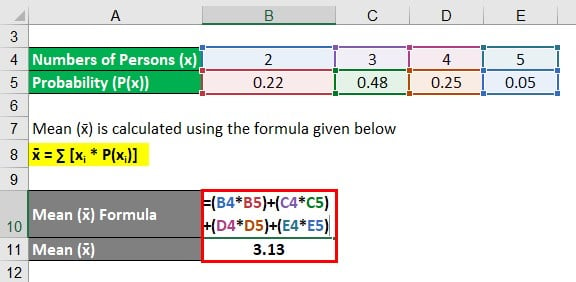
- Mean (x̄) = 2 * 0.22 + 3 * 0.48 + 4 * 0.25 + 5 * 0.05
- Mean (x̄) = 3.13
The Standard Deviation (ơ) is calculated using the formula given below
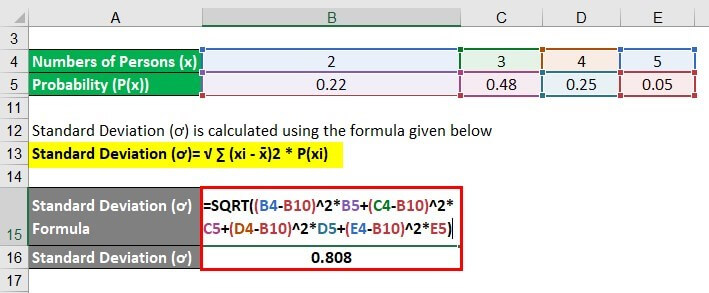
- Standard Deviation (ơ)=√ [(2 – 3.13)2 * 0.22 + (3 – 3.13)2 * 0.48 + (4 – 3.13)2 * 0.25 + (5 – 3.13)2 * 0.05]
- = 0.808
Therefore, according to the survey, the expected number of persons per family is 3.13, with a standard deviation of 0.808.
Example #2
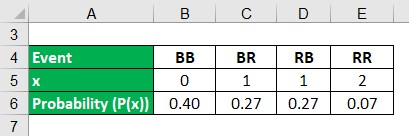
Let’s take the example of a bag with 2 red balls and 4 blue balls. If two balls are drawn randomly without replacement, then calculate the expected number of red balls and their standard deviation.
Key:
BB: 2 Blue balls
BR: 1 Blue and 1 Red ball
RB: 1 Red and 1 Blue ball
RR: 2 Red balls
Solution:
The Mean (x̄) is calculated using the formula given below:
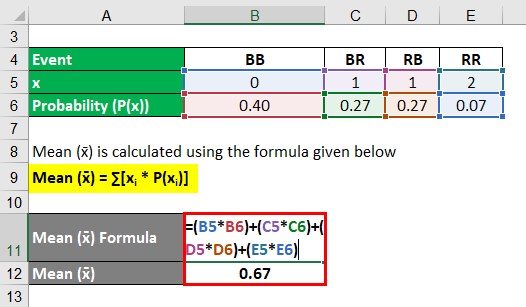
- Mean (x̄) = 0 * 0.40 + 1 * 0.27 + 1 * 0.27 + 2 * 0.07
- = 0.67
Standard Deviation (ơ) is calculated using the formula given below:
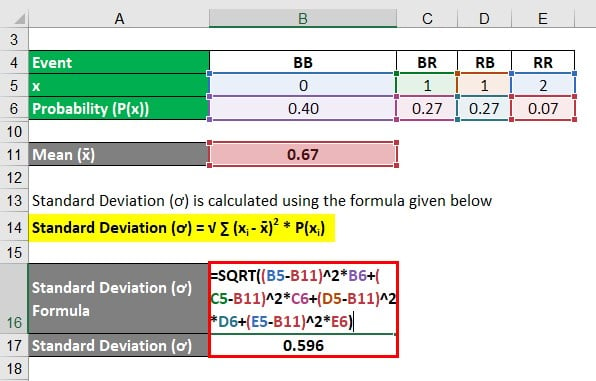
Let’s calculate Standard Deviation using the formula:
- Standard Deviation (ơ) = √ [(0 – 0.66)2 * 0.40 + (1 – 0.66)2 * 0.27 + (1 – 0.66)2 * 0.27 + (2 – 0.66)2 * 0.06]
- = 0.596
Therefore, the expected number of red balls is 0.67 in this case, with a standard deviation of 0.596.
Explanation
The formula for a mean and standard deviation of a probability distribution can be derived using the following steps:
Step 1: First, determine the values of the random variable or event through several observations, denoted by x1, x2, ….., xn, or xi.
Step 2: Next, compute the probability of occurrence of each value of the random variable, and they are denoted by P(x1), P(x2), ….., P(xn), or P(xi).
P(xi) = No. of Events with ith Value / Total No. of Events
Step 3: The formula for the mean can be derived by adding up the products of the value of the random variable (step 1) and its probability (step 2), as shown below:
x̄ = ∑[xi * P(xi)]
Step 4: Compute each value’s deviation (step 1) of the random variable from the probability distribution’s mean (step 3).
Di = xi – x̄
Step 5: Next, The formula for standard deviation can be derived by adding up the products of the squares of the deviation of each value (step 4) and its corresponding probability (step 2) and then computing the square root of the result, as shown below.
ơ = √[∑(xi – x̄)2 * P(xi)]
Relevance and Use of Probability Distribution Formula
The concept of the probability distribution formula is very important, as it estimates the expected outcome based on all possible outcomes for a given range of data. One of the most crucial aspects of a probability distribution is the definition of its function, as every other parameter revolves around it. Probability distribution finds applications in various areas, such as calculating the return of an investment portfolio, hypothesis testing, predicting the expected growth of a population, etc.
Probability Distribution Formula Calculator
You can use the following Probability Distribution Formula Calculator
| xi | |
| x̄ | |
| P(xi) | |
| ơ | |
| ơ | = √[∑(xi - x̄ )2* P(xi) ] |
| √[∑(0 - 0 )2* 0 ] = 0 |
Frequently Asked Questions(FAQs)
Q1. What are the common types of probability distributions?
Answer: The most common types of probability distributions are Normal distribution, Binomial distribution, Poisson distribution, Exponential distribution, and Uniform distribution.
Q2. What is the normal distribution formula?
Answer: The normal distribution formula is:
f(x) = (1/σ√(2π)) * e^(-(x-μ)^2/2σ^2)
Where μ is the mean, σ is the standard deviation, and e is Euler’s number (2.71828…).
Q3. What are the real-world applications of the probability distribution formula?
Answer: Probability distribution formulae use in various domains, including physics, finance, engineering, and economics, making predictions about future events and informed decisions based on data analysis.
For instance, probability distribution models can help a financial analyst determine the probability of various levels of return on a particular investment. If the expected return is $100 and the standard deviation is $20, the formula can help estimate the probability of earning less than $80 or more than $120. As a result, this data can help investors make well-informed decisions about risk management and investment strategies.
Recommended Articles
This is our guide to Probability Distribution Formula. Here are some further articles for expanding understanding:
