Updated July 27, 2023
Binomial Distribution Formula (Table of Contents)
What is Binomial Distribution Formula?
The binomial distribution is the probability distribution formula that summarizes the likelihood of an event occurring either A wins, B loses, or vice-versa under a given set of parameters or assumptions.
However, there is an underlying assumption of the binomial distribution where only one outcome is possible for each trial, either success or loss. And each trial in itself is mutually exclusive from another one.
Suppose if we have defined one outcome out of two is defined as a success, then the probability of x successes out of N trials can be computed as:
Where p is the probability of success on one trial.
Examples of Binomial Distribution Formula
Let’s take an example to understand the calculation of Binomial Distribution in a better manner.
Binomial Distribution Formula – Example #1
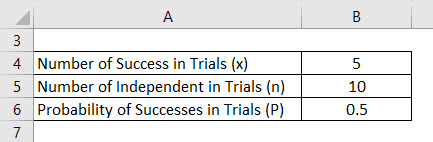
A coin is flipped 10 times. Calculate the probability of getting 5 heads using a Binomial distribution formula.
Solution:
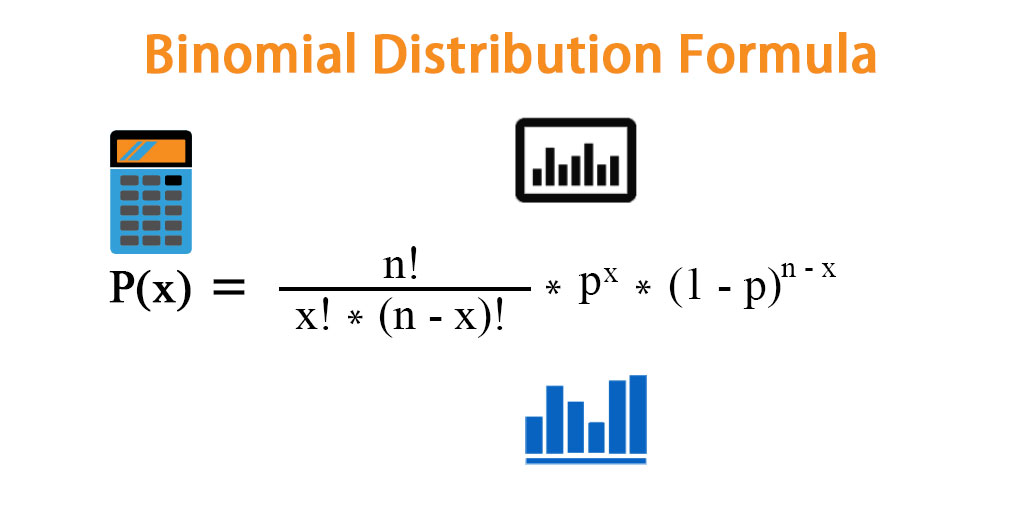
The formula to calculate Probability using the binomial distribution is as below:
P(X) = (n! / (x! * (n – x)!)) * px * (1 – p)(n-x)
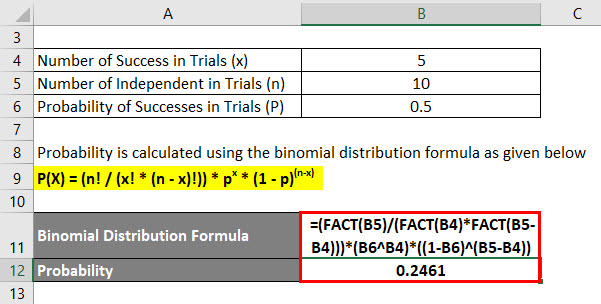
- P(x=5) = (10! / (5! * (10 – 5)!)) * (0.5)^5 * (1 – 0.5)^(10 – 5)
- P(x=5) = (10! / (5! * 5!)) * (0.5)^5 * (0.5)^5
- P(x=5) = 0.2461
The probability of getting exactly 5 successes is 0.2461
Binomial Distribution Formula – Example #2
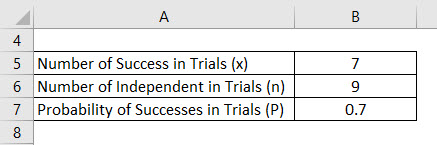
In a study, it is found that 70% of people who purchase pet insurance are mostly women. If we randomly select 9 pet insurance owners. What is the probability that of the 7 will be women?
Solution:
The formula to calculate Probability using the binomial distribution is as below:
P(X) = (n! / (x! * (n – x)!)) * px * (1 – p)(n-x)
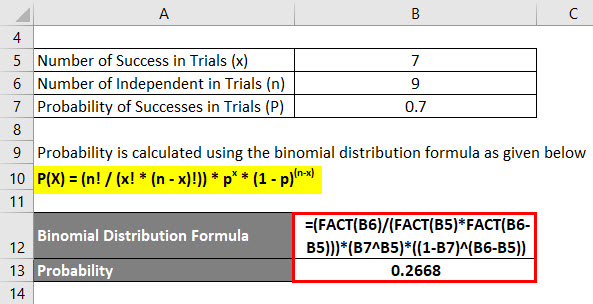
- P(x=7) = (9! / (7! * (9 – 7)!)) * (0.7)^7 * (1 – 0.7)^(9 – 7)
- P(x=7) = (9! / (7! * 2!)) * (0.7)^7 * (0.3)^2
- P(x=7) = 0.2668
Binomial Distribution Formula – Example #3
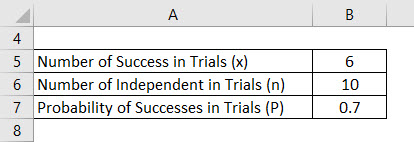
Last year in a survey of Autocar India, it was found that 70% of buyers of sports cars are men. Suppose 10 sports car owners are randomly selected. What is the probability that of the 6 will be men?
Solution:
The formula to calculate Probability using the binomial distribution s as below:
P(X) = (n! / (x! * (n – x)!)) * px * (1 – p)(n-x)
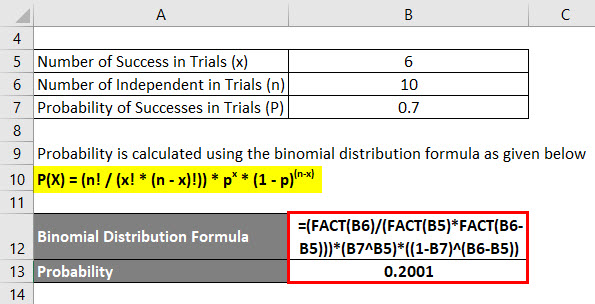
- P(x=5) = (10! / (6! * (10 – 6)!)) * (0.7)^6 * (1 – 0.7)^(10 – 6)
- P(x=5) = (10! / (6! * 4!)) * (0.7)^6 * (0.3)^4
- P(x=5) = 0.2001
Explanation
A binomial distribution depends much more on the number of trials or observations done. At the same time, each trial defines its own probability of outcome value or, in other words. A binomial random variable is a successful outcome of x in n number of the repeated trial of a binomial experiment. In contrast, a binomial random variable’s probability distribution is also known as a binomial distribution.
For example, when we toss a coin, the probability of obtaining a head is 0.5 of 50% out of 100%. If we perform 100 trials. The expected value of obtaining heads is 50(100 x 0.5). The binomial distribution is a statistical term used to predict an event’s outcome, like the probability of a sportsman winning a competition.
There are certain steps and rules to use the formula to meet the specific criteria of Binomial Distribution models.
Step 1: Fixed Trials
In this course of action, a set of a fixed number of trials can’t be altered during the process. The number of trials in the binomial probability formula is represented by the letter “n”. In our case, flip, a coin, free throws, and wheel spins are the fixed number of trials.
Step 2: Independent Trials
Independent Trial is another condition of a binomial probability in which trials are independent of each other, where the outcome of one trial doesn’t impact much more on the subsequent trials.
For example, independent trials, maybe tossing a coin or rolling dice, are independent of the subsequent events.
Step 3: Fixed Probability of Success
In this type of distribution, the probability of success remains the same for all trials. For example, if we toss a coin, the probability of an outcome of every event, either head or tail, is 0.5 since there are two possible outcomes.
Step 4: Two Mutually exclusive Outcomes
Only two mutually exclusive outcomes exist in this distribution: success or failure. Where success has been defined in a positive term. The trial aims to validate what we have defined as a success. Either it is positive or negative.
Relevance and Uses of Binomial Distribution Formula
The binomial distribution model is the most important probability model; it is required when two possible outcomes are expected. It came into existence when there were more than two distinct outcomes. In that case, a multinomial probability is more appropriate. But here, our major concern is more on the situation where the outcome is dichotomous.
The use of the binomial distribution requires three models:
- Each process outcome results in one or two outcomes, either success or failure.
- The outcome of each process results in the same probability.
- Each outcome is mutually exclusive to the other of the process.
Binomial Distribution Formula Calculator
You can use the following Binomial Distribution Calculator.
| n | |
| p | |
| x | |
| Binomial Distribution Formula | |
| Binomial Distribution Formula = | [n ! / x ! * (n - x) !] * px * (1 - p)n - x | |
| [0! / 0! * (0 - 0)!] * 00 * (1 -0)0-0 = | 0 |
Binomial Distribution Formula in Excel (With Excel Template)
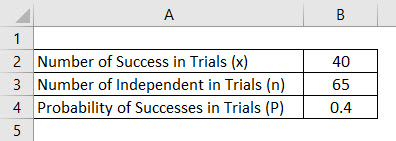
Here we will do another example of the Binomial Distribution in Excel. It is very easy and simple.
Calculate the Binomial Distribution in Excel using the function BINOM.DIST.
Below is the Syntax of the Binomial Distribution formula in Excel.
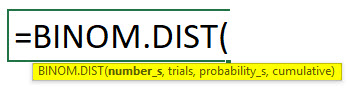
Where the Binomial distribution uses the following argument:
- Number_s: Defines the number of success in the trial.
- Trials: Number of independent trials.
- Probabiity_s: Success probability in each trial.
- Cumulative: Allows to pick logical value, either True or False.
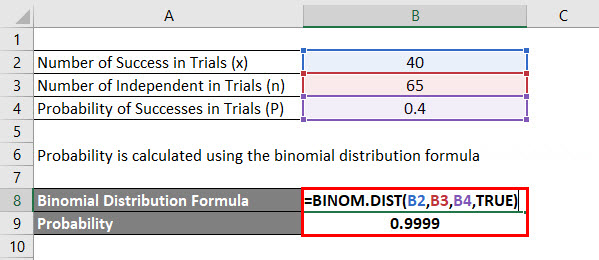
Probability is calculated using the binomial distribution formula is calculated as:
Recommended Articles
This has been a guide to Binomial Distribution Formula. Here we discuss how to calculate Binomial Distribution along with practical examples. We also provide a Binomial Distribution calculator with a downloadable Excel template. You may also look at the following articles to learn more –
