Updated March 22, 2023
Introduction to Power BI KPI
KPI (Key Performance Indicators) are those parameters that help us to analyze the data. Every data we want to use in Power BI has some parameters or KPI that drive the graph’s figures we want to see. We should monitor the KPIs of the data to analyze the changes, growth, downfall in the data. These KPIs become measurement points as well and help us in tracking the business. With the help of KPI visuals in Power BI, we can actually get the points that we want to hit to improve the business. We actually see, what target we have fixed and what actual figures we are getting on charts with the KPIs.
Types of KPI in Power BI Dashboard
There are 2 types of KPIs in Power BI.
1. Single KPI: Single KPI has 3 sets of fields which are Indicator, Trend Axis and Target Goal.
Where,
- Indicators: Shows the actual values against targeted values.
- Trend Axis: This should be the month name or number axis line.
- Target Goal: Shows the target which is to be achieved.
2. Dual KPI: Dual KPI has Axis, Top Value and Bottom Values.
Where,
- Axis: Has the month name or number.
- Top and Bottom Values: These are Top and Bottom values from the single KPI chart.
How to Use KPI Visuals in Power BI?
Below are the different examples to use KPI visuals in Power BI dashboard:
KPI in Power BI – Example #1
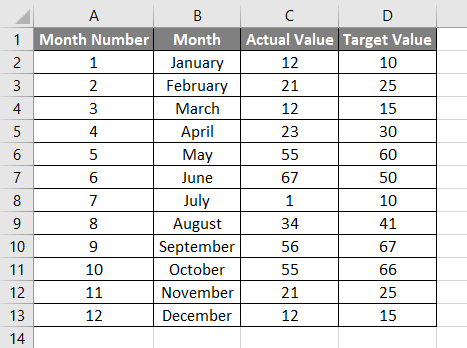
In this example, we will see Single KPI. For this, we have data as shown below. So you can download the excel workbook from the below link which is used for this example.
Where we have Month Number, Month, Actual and Target Value. All these values are required as per the fields therein Single KPI as we have seen above.
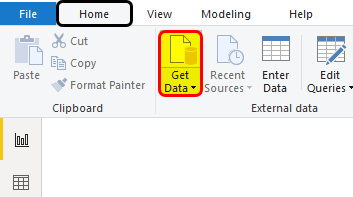
- Go to Power BI and click on Get Data option as shown below.
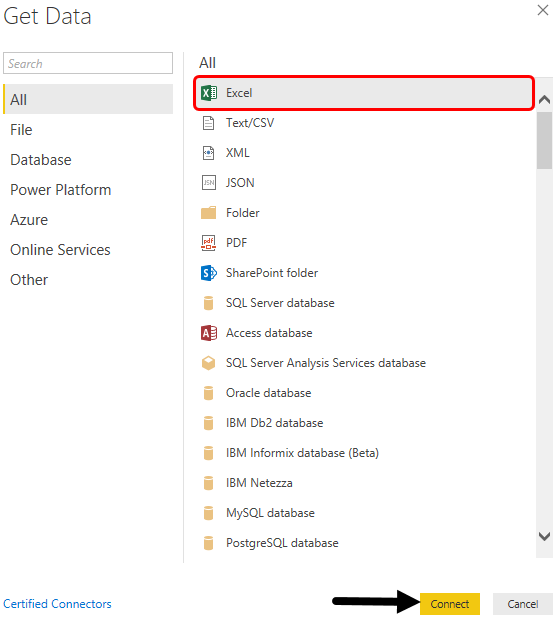
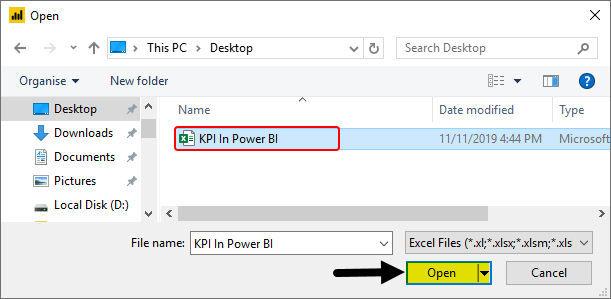
- Select the excel file as shown below and Connect.
- Browse and select the file.
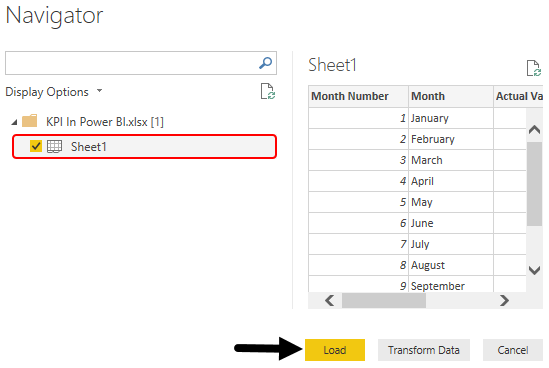
- Check the Sheet name which has the data. Here our sheet is Sheet1. After that click on the Load button as shown below.
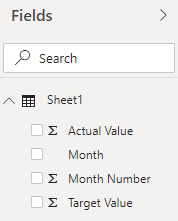
- We will be able to see the uploaded data header’s name in the Fields section.
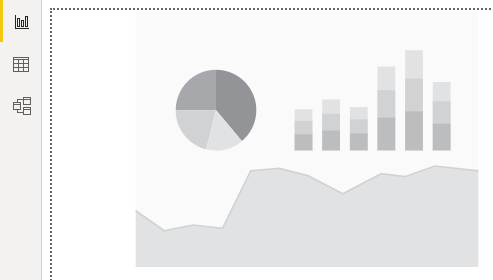
- Select KPI visualization type from the Visualization section as shown below. We will see the preview of the KPI chart in the report screen only.
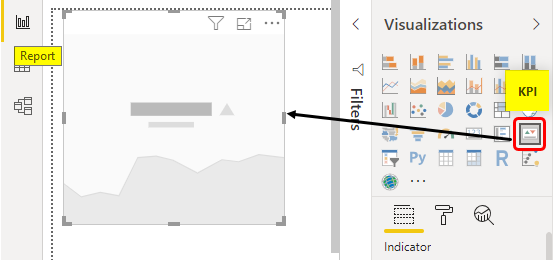
We can here increase and adjust the size of the KPI chart as per our requirement.
- Now as we have seen at the start of the article, as per that we will now drag the related fields into the relevant sections as shown below.
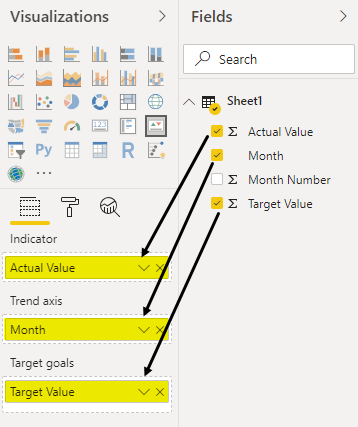
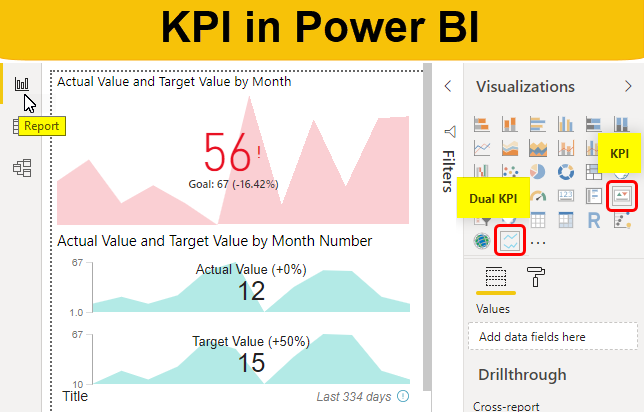
- Once we do that, we will see our Single KPI chart got the values in it.
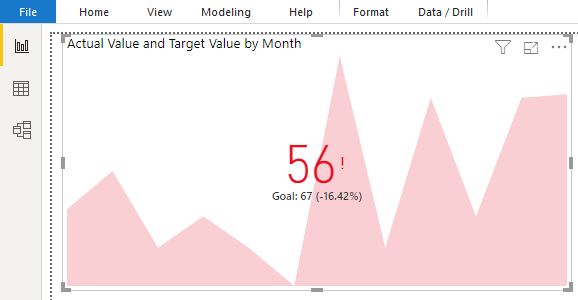
This is the final Single KPI Chart which is built in Power BI.
KPI In Power BI – Example #2
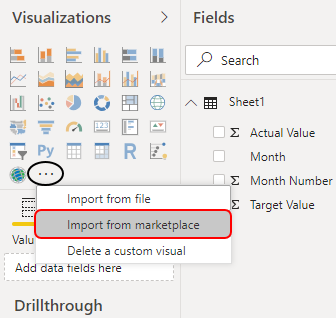
Dual KPI chart is not built in Power BI visualization and not easy to access. For this, you need to click on 3 dots at the bottom of Visualization as shown below. This will give us a list of sources from where we can add new visualizations. Now select Import From Marketplace option.
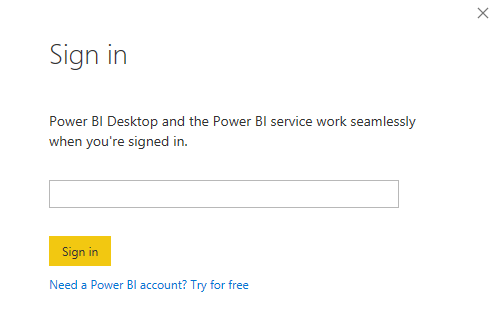
- A Sign-in window will appear which will ask us to Sign in or Login. If you are working in an organization then you can sign in using your company credentials or else any student login id of Outlook will also work here.
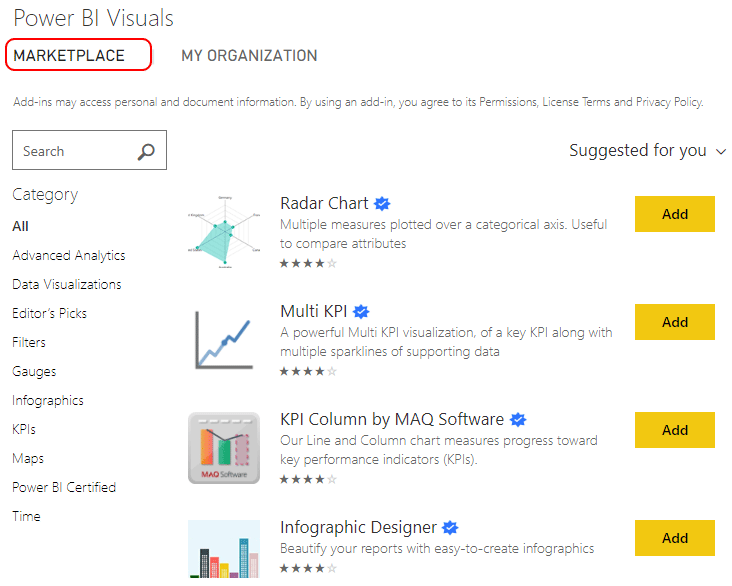
- Once we do that, this will take us to Power BI Visuals Market Place as shown below. This is the place where we can select any visuals we want and add them to our list.
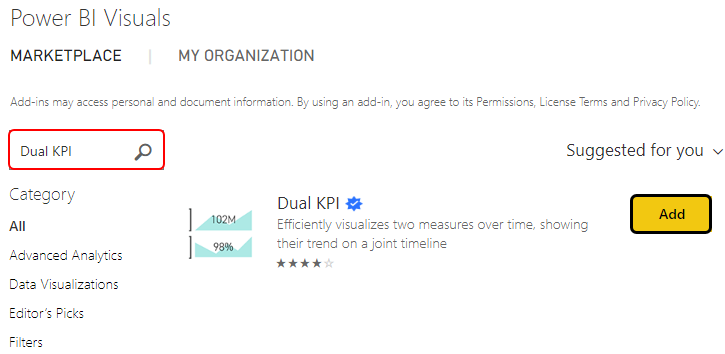
- In the search box, search Dual KPI and click on Add as shown below.
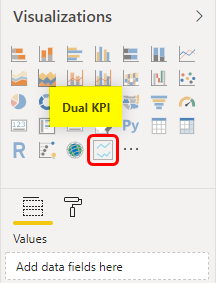
- After that, we will be able to find the Dual KPI visuals in the Visualization section of Power BI as shown below. Now select the Dual KPI from visualization.
- Dual KPI Chart looks like as shown below. This chart has 2 KPI charts which are drawn by the main chart located at the bottom of it.
- Now we will drag and add respective fields here as shown below.
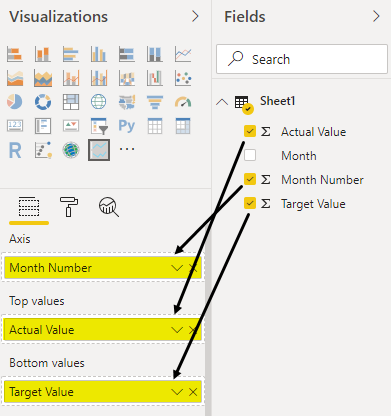
- Our Dual KPI chart will look like this as shown below. As we can see, the chart has Actual and Target value graphs separately above and below. By this, we can easily compare the Actual and Target values.
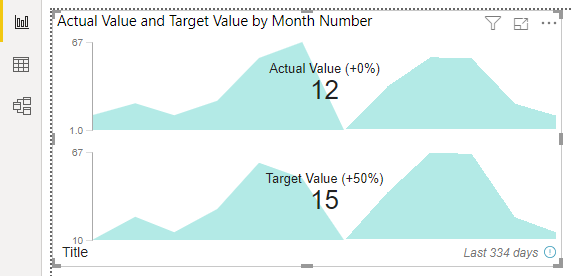
And the good thing about this chart is when we move the cursor over the chart, we will be able to see Actual and Target values together at any point.
Pros & Cons of KPI in Power BI Dashboard
- This is quite good at comparing the 2 sets of fields Actual and Target easily.
- Single KPI charts are easy to implement.
- We can see the change of data when we move a cursor on the graphs.
- Those who don’t have login ID may not able to add new visualization from Market Place.
Things to Remember
- Dual KPI Chart is not by default available in visualization. We need to download and add additional charts from Power BI Market Place for further use.
- It is recommended to use Dual or Multi KPI charts over single or default KPI chart. Because Dual or Multi KPI charts give more accurate values at all points.
- We can import any custom visual from Market Place.
- We can insert the data by copy-pasting the values into the cell if the input file has very less data as seen in the above examples.
- While working with huge data, always save the file in Power BI on different multiple intervals to avoid losing the data.
- Dual KPI charts don’t allow us to use the Month name. It always prefers the month number.
Recommended Articles
This is a guide to KPI in Power BI Dashboard. Here we discuss how to use Power BI KPI (Key Performance Indicator) Visuals along with a practical example. You may also look at the following articles to learn more –
