Updated March 27, 2023
Drillthrough in Power BI
Drill through in Power BI is used for filtering the data with certain values and parameters so that the user can focus on the things he/she wants to show. Most of the time when we create any dashboard or charts in Power BI or in any other tool we concentrate on showing the overall progress report of the project or business. But with the help of Drillthrough operations in Power BI we can filter the data as per requirement and break that into small projections so that getting the actual figures of mail data set becomes easy.
How to Use Drillthrough Filter in Power BI?
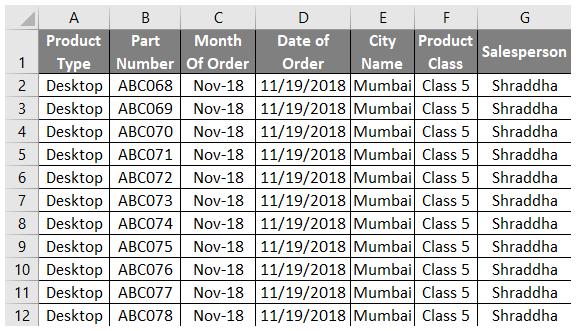
For using Drillthrough in Power BI, we need to follow the steps for creating a dashboard view in Power BI first. And for that, we need data to work on. Below we have the screenshot of sales data of some electronic products such as Laptops, Desktops, Tablets, and Mobiles. And this sales data consists of different categories such as Salesperson, regional customer name, unit price, quantities, and dates. And the maximum range of the data is up to 1000 rows.
We can sort the data if required. Here we will be sorting the data once we start working on it in Power BI views as then require. You can also download the excel workbook from the below link which is used for this example.
Let’s go through a step-by-step procedure and use Drillthrough in Power BI. The steps in detail are as follows:
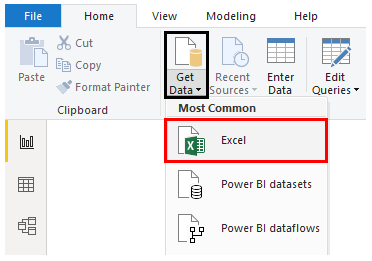
- Load the dataset into Power BI. For that click on Get Data Menu under Home Tab. From the drop-down menu of Get Data, select appropriate data source type. In this case, it is Excel, so clicked on Excel as shown in the below screenshot.
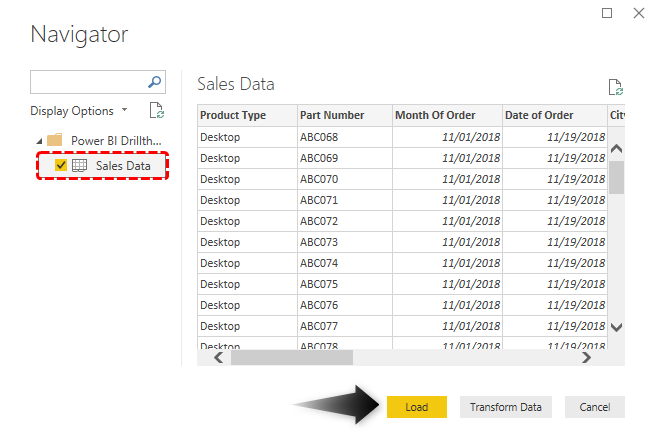
- From the drop-down menu of Get Data option, select the type of file source which we want to upload. Here, our data is in Excel format. Once we select the file, in the navigator window, it will ask us to select the sheet which we want to upload. It is because, there might be more than 1 sheet with the data but the sheet we want to choose can be anything. After that, click on the Load button highlighted in yellow to load the data into Power BI.
A few moments later, the Sheet will get uploaded in Power BI.
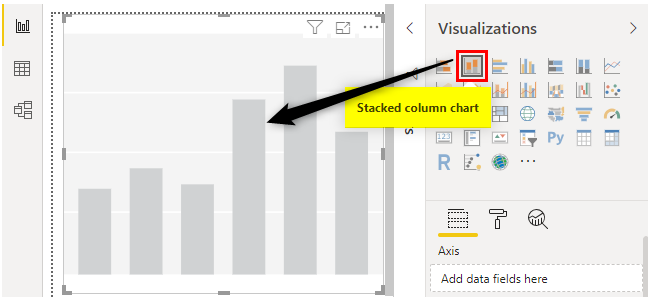
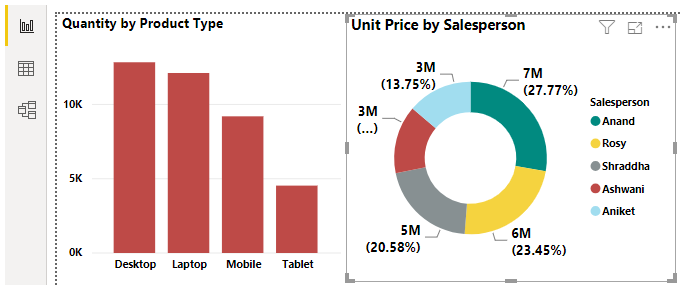
- Let’s create our first view, by which we will show different sale of all products types. For this select Columns Stacked chart from visualization.
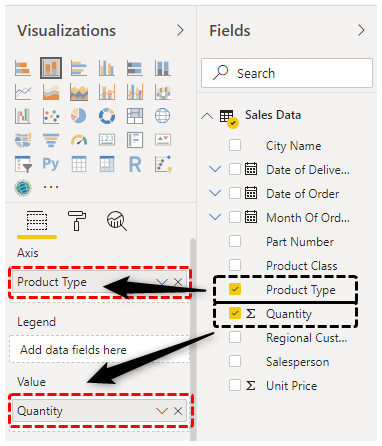
- Drag the Product type and Quantity fields into Axis and Value section of selected visualization.
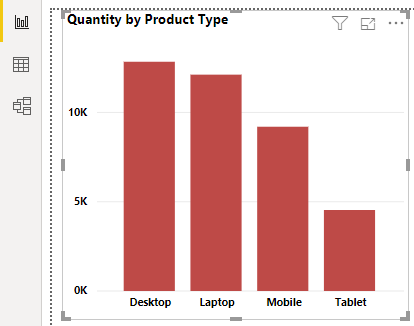
- Do the basic formatting such as data color, data labels as per need to get a final view.
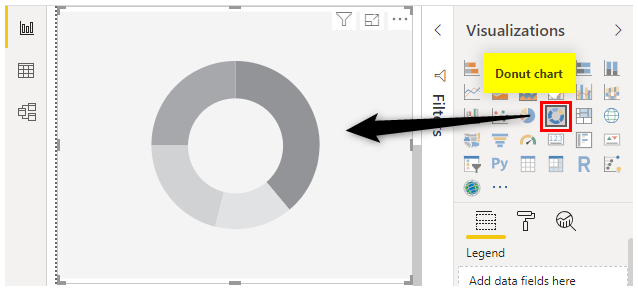
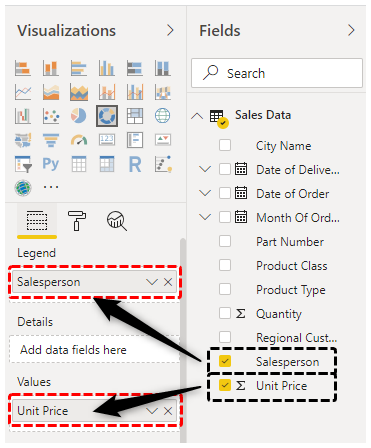
- Now we will create a Pie Chart or Donut chart by which we will show Sales person wise graph. For this select the Donut chart from the visualization.
- Now drag the respective fields to see the values in selected Donut charts. Here we have selected Sales person names and quality sold by them.
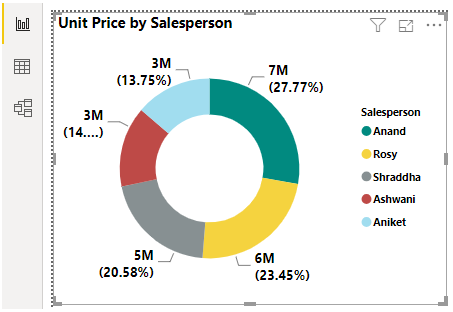
Then our Donut chart will look like as shown below. In that, we can clearly see, out of the total sale, which Sales person holds what percent of the shares.
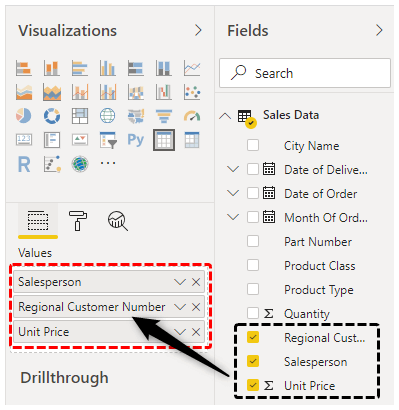
- Now, we will insert another Page in Power BI report and name it as Customer-Wise Projection. As we can see in the screenshot of the data which we have uploaded in Power BI, we have a column as Regional Customer Number, which we will use here.
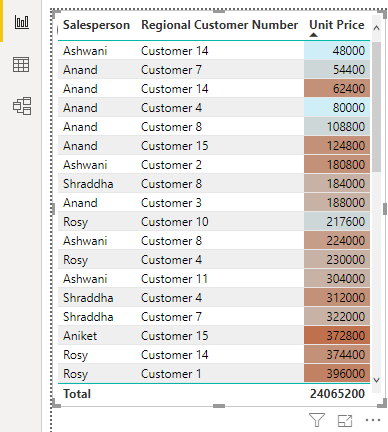
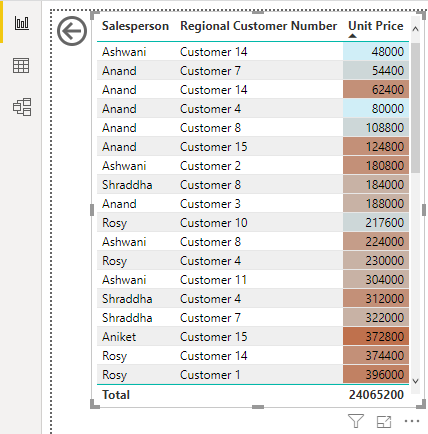
- Now we will drag Salesperson, Regional Customer Number and Unit Price into the values.
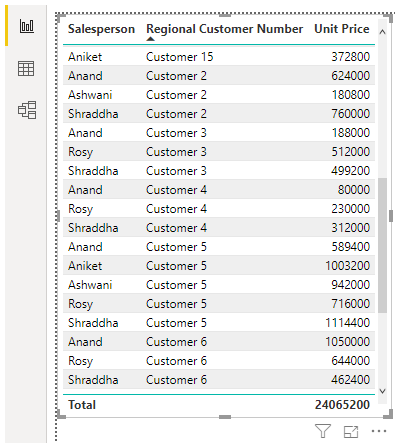
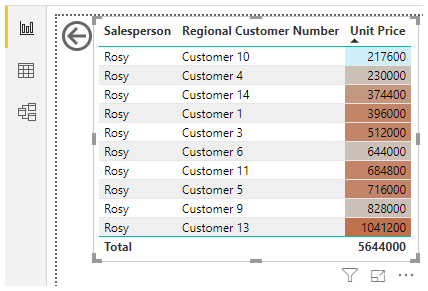
- This will give our table chart as shown below where we can see which salesperson has what customer numbers under that how much sale he/she has pulled up.
- After formatting, the table chart will look like this as shown below.
- We will then create another page for Customer and volume-wise sale as shown below.
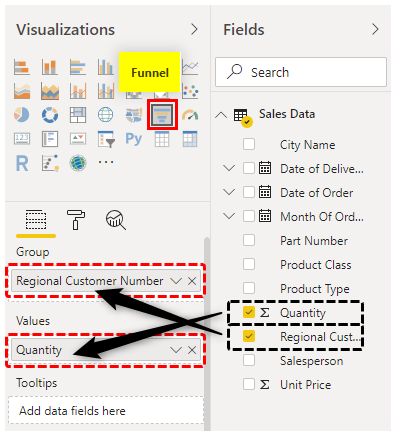
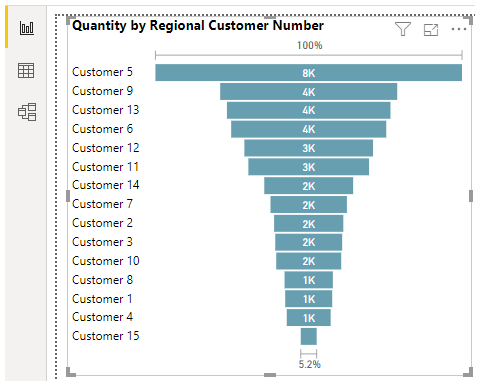
- Here, select the Funnel chart and then drag the Regional customer number and Quantity in the relevant fields section.
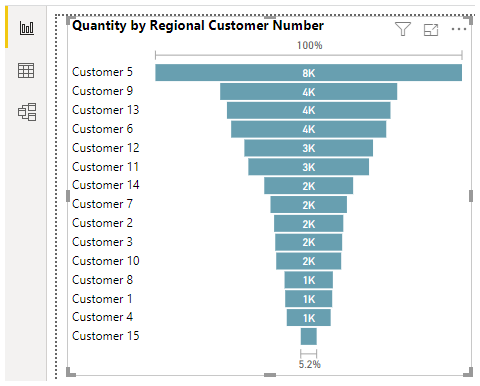
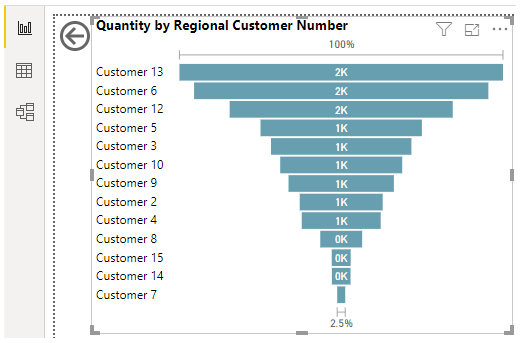
- After formatting, we will have our funnel chart as shown below. This will show which customer has order how much quantities of products.
Now here comes a point, where we will add drillthrough in each of the page which we have created. We will create a breakup of complete sales data with sales person’s names.
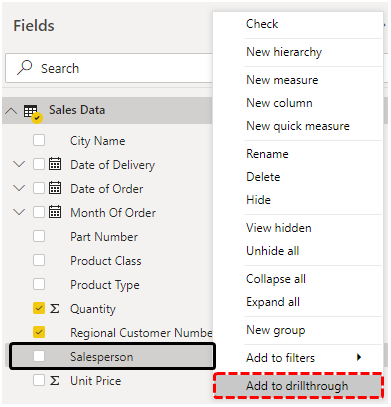
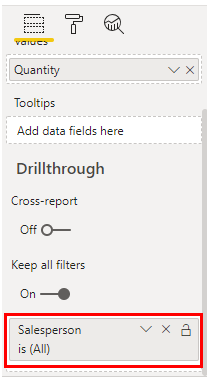
- For this, in the current sheet which is Customer v/s Volume, click right on Salesperson in the field section and select Add to drillthrough from menu list.
- We will see, Salespersons name will get added into drillthrough.
- Once we do that, we will see a back arrow will appear on the graph.
- Now we will add Salesperson from the Customer-wise Projection page into the Drillthrough section.
- Now we are all set with all Drillthrough which we could require. After that, we will go the first page where we have created Donut Chart for Salespersons and Column chart for the product type.
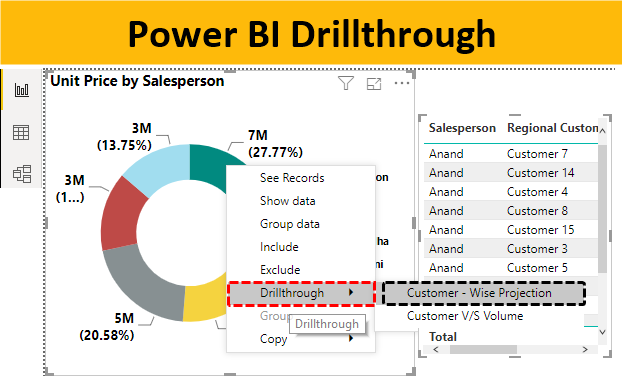
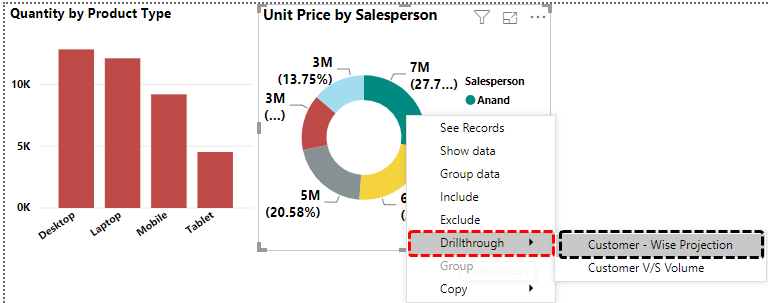
- As we can see in the above screenshot, in Donut chart we have all the Salespersons names and their respective sales numbers. This chart has Anand, Rosy, Shraddha, Ashwani, and Aniket as the salespersons. Now suppose we want to drill through any of the salespersons, let say Rosy. Then click right on that name and select the option Drillthrough from there. Let’s select Customer-wise Projection first.
- We will see the drillthrough will take us the second page and filter the data with the name Rosy. Go back, Click+Ctrl on back arrow.
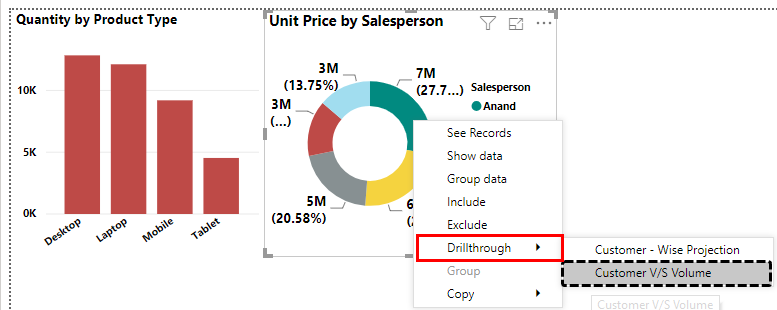
- Now if we want to drillthrough Anand’s data then click right on it and select Customer vs Volume.
- This will directly take us to that page and data will also get filtered.
Similarly, we can apply Drillthrough and get a deep insight of any project.
Note: I have done so much of formatting to this table and charts, you can download the Power BI Drillthrough file from below link and apply each formatting technique as applied.
Power BI-
Pros of Power BI Drillthrough
- This helps us in getting deeper into project data.
- We can analyze any part of the data set.
- We can create any number of drillthrough views.
Things to Remember
- First, find the area which you want to dig to get insight.
- With the help of the Back button, we can go back to the first page.
- Drillthrough only provides the breakup of report or we can filter the focus group and perform our further analysis.
- Drillthrough is like filtering the data. But this filters all the created charts with relevant fields we choose.
Recommended Articles
This is a guide to Power BI Drillthrough. Here we discuss how to use Drillthrough Filter in Power BI with an example and downloadable template. You may also look at the following articles to learn more –

