Updated March 27, 2023
Themes in Power BI
A theme in Power BI pertains to aspects of the appearance of visualization. One of the dictionary definitions of themes is “an idea that is concerned with art or literature”. In Power BI, we can modify the themes in the required manner. As a BI and analytics tool, Power BI offers numerous options from amongst which the user can select the requisite theme. However, it should be remembered that a theme is concerned not just with the design or settings pertaining to the appearance of the dashboard or report. Rather, the aim of having various themes is to make the analysis alive.
Applying Power BI Themes
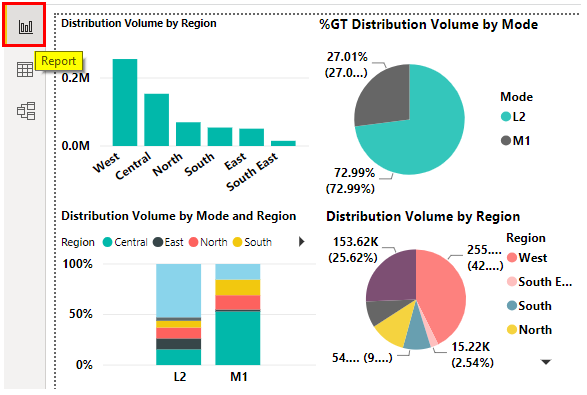
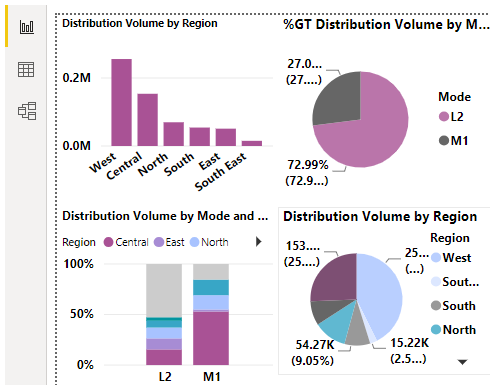
In order to understand the use of the Power BI theme, we will go through a demonstration. For this demonstration, we are using Distribution Volume dataset. The dataset contains details pertaining to volume distributed across India by dimension City. Higher dimensions viz. Distribution Unit and Region are also present in the dataset. Another dimension in the dataset is city. Distribution Volume is the measure in the dataset.
The following screenshot shows the analysis done in Power BI which has been described above.
Now, we will explore how to apply themes and allied concepts. This is as described in the below section. Let’s go through a step-by-step procedure to apply Power BI Themes. The steps in detail are as follows.
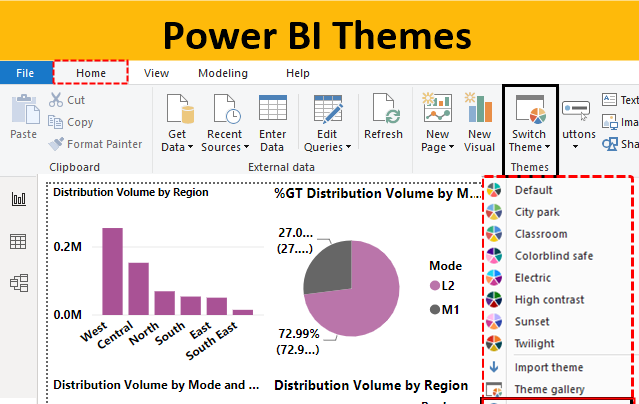
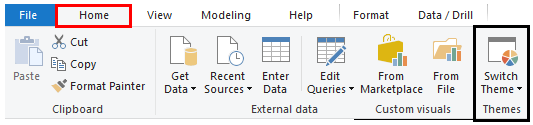
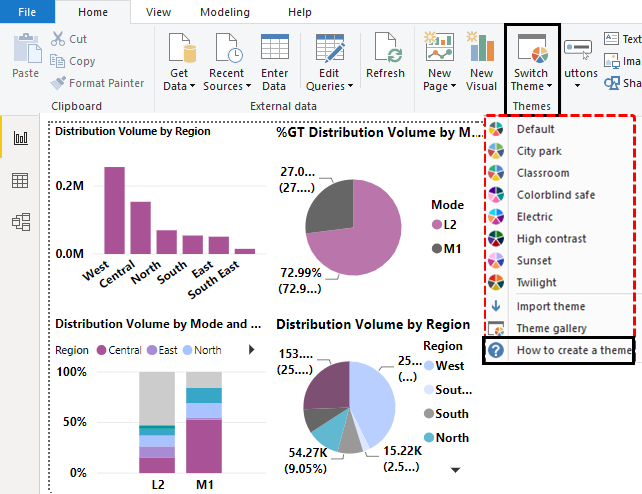
- Step 1: In order to change the theme, Open Power BI visualization software. And go to the Home tab and find the “Switch Theme” option.
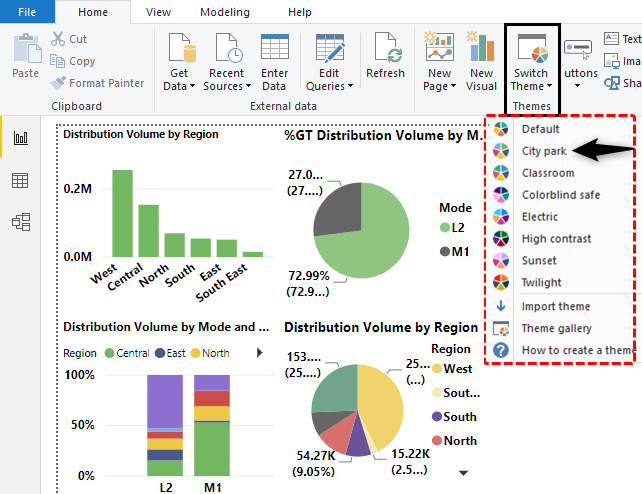
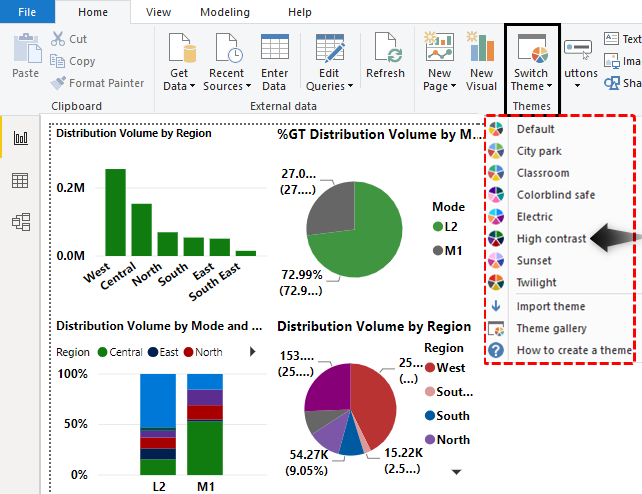
- Step 2: In order to change the theme, click on the drop-down menu of the “Switch Theme” options in the Home menu. This is as shown in the below screenshot. The current theme is Default along with which there are various themes from amongst which we can choose the desired one.
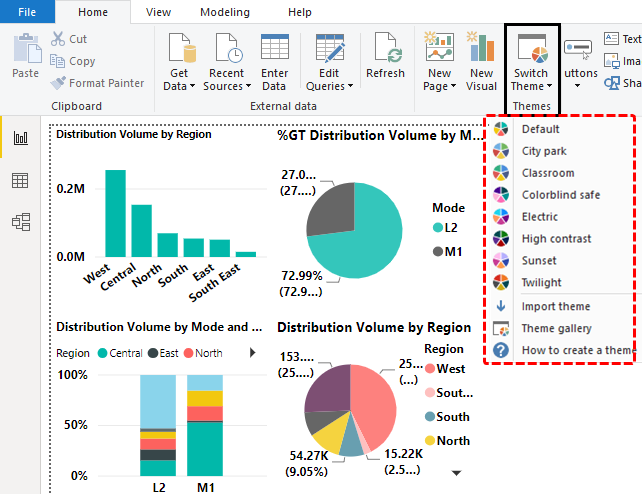
- Step 3: We can find some more options like City Park, Classroom, etc. As we can see below, we applied the “City Park” theme. Note, the colors and formatting have changed. We find the use of green shades more.
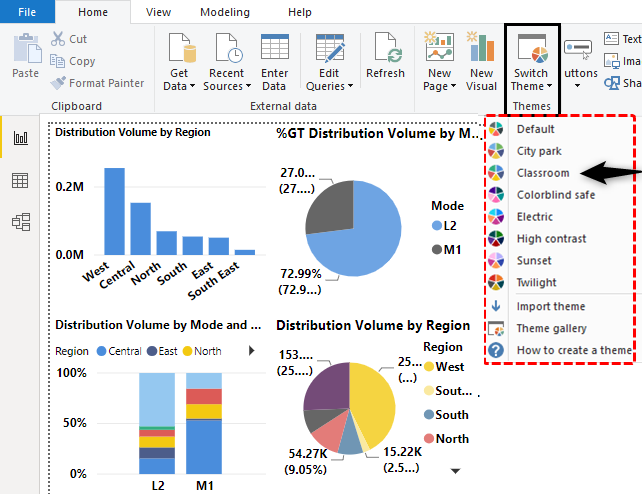
- Step 4: The following screenshot demonstrates the use of the “Classroom” theme. It looks more appealing as compared to the previous one. Here, we find more use of the shades of blue color.
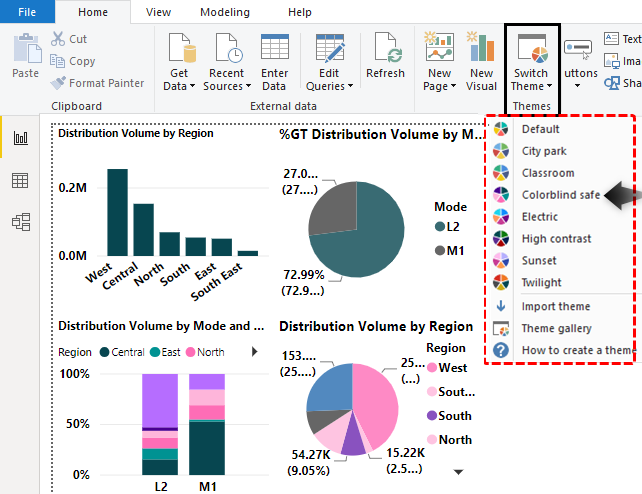
- Step 5: The following screenshot shows how applying the “Colorblind Safe” theme has changed the appearance of the visual analysis. The theme affects the background color.
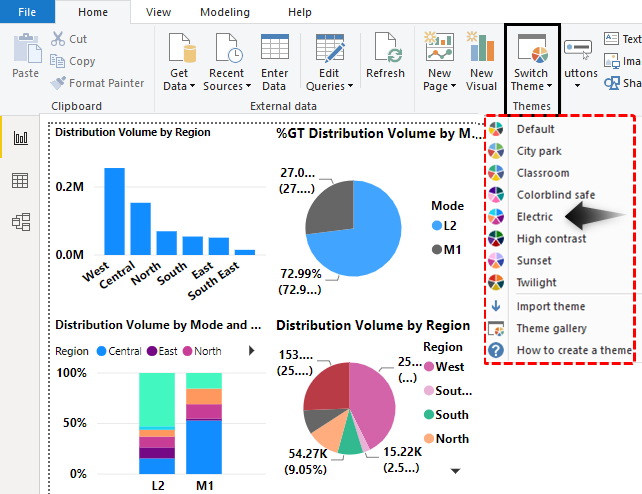
- Step 6: The following screenshot shows how applying the “Electric” theme affects the color and formatting. Use of dark blue shade is more here. Note, how in the pie chart, darkest blue color corresponds to the Distribution Unit that has the highest contribution in the total Distribution Volume. As we move from the highest to the lowest, the shade of color 2 goes off becoming lighter and lighter till it turns into pink. After the color changes to pink, the shade goes on becoming darker and darker for lower values. And again after the darkest shade of the pink-red combination, a different color is taken into consideration.
- Step 7: The following example shows that themes do not just pertain to changing colors or formatting. Rather, they carry latent meaning which is very important in the given problem context. As a result, a theme should always suit the analysis, because colors and formatting have much to do with how the insights are conveyed. They shouldn’t just make the visualization appealing but also enable easy and effective insight capturing.
Designing Power BI Themes
Power BI comes with a variety of built-in design themes which can be used as per the requirement. Let us look at a few themes demonstrated below. Power BI allows us to create Themes that can be imported. These are JSON files. The following JSON code creates a Power BI theme.
Code:
{

"name": "Manmade Theme",

"dataColors": [

"#a95295",

"#a78cd4",

"#a8c3ff",

"#38a6c6",

"#02949f",

"#cccccc"

]
}
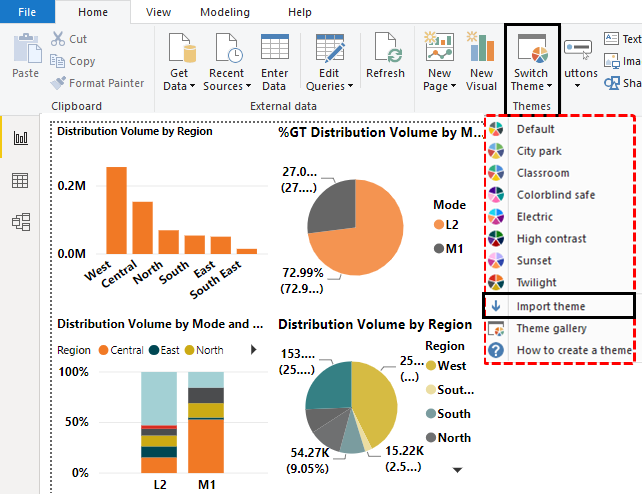
- Step 1: We’ll import the above theme into Power BI. First, click on the Import Theme option as shown below.
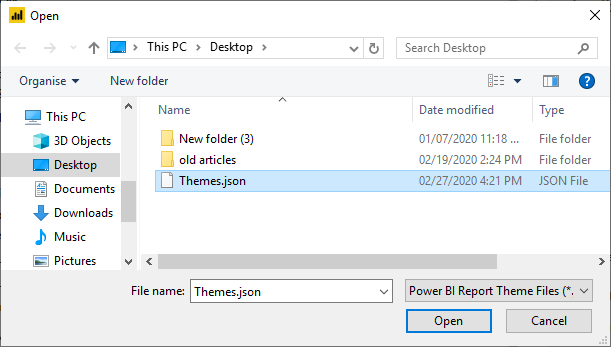
- Step 2: Select the Manmade.json file and click on Open as demonstrated in the below screenshot.
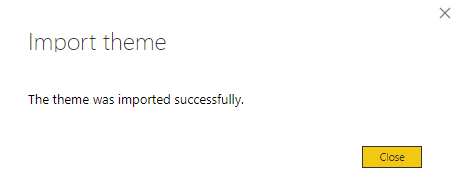
- Step 3: As we can see in the below screenshot, the imported theme has been applied successfully.
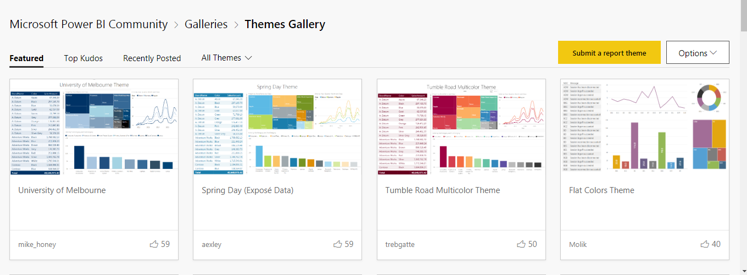
- Step 4: Now we will Explore the Themes gallery. We can explore more Power BI themes by clicking on “Theme gallery” in the drop-down menu. This is as illustrated in the below screenshot. Just scroll down to discover the desired theme from the options.
- Step 5: Here we will see “How to create a theme” functionality. It is an extensive guiding material that familiarizes the user with the concept of themes in detail. Note, Power BI, along with offering Built-In themes, supports user-created themes. These are JSON formatted files.
Customized Power BI Themes
We can have themes customized by selecting requisite settings and colors applied. For each object, we can format the settings. This is as demonstrated below.
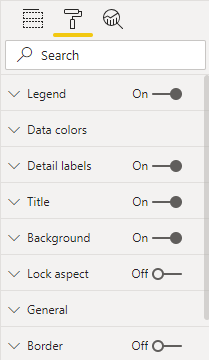
- Step 1: In the following screenshot we find multiple options in “Format”. In order to make formatting changes, just select any object. We have options ranging from Legend, Data color to Look aspect to Border. It is these elements viz. Name, Foreground color, Background color, Table settings, and Data colors that make a theme.
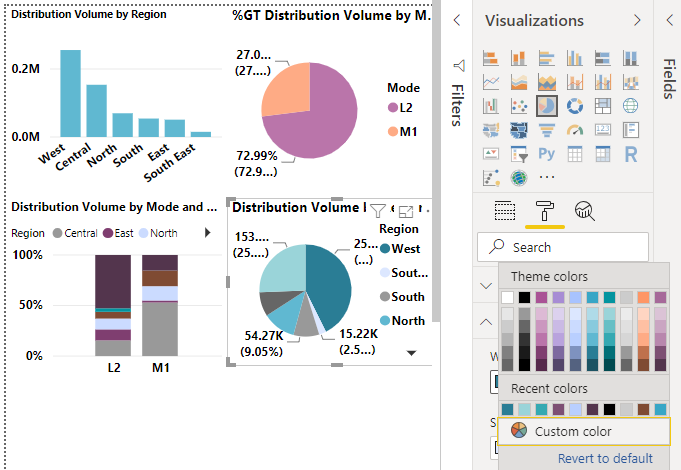
- Step 2: The following screenshot shows how we can change the color of pies in the pie chart. Using these options we can have our own customized theme.
Things to Remember
- Each of the themes ensures that the association of color and formatting with the data allows easy understanding of pattern or trend as depicted by the data, and so, multiple themes must experiment prior to reaching a decision on which theme to use.
- Some of the theme-related options in Power BI navigates us to Microsoft community, access to which requires internet connectivity. A plethora of information on themes is provided over the online community forum.
Recommended Articles
This is a guide to Power BI Themes. Here we discuss how to apply the default theme of the dashboard report and to design your own Power BI theme using JSON Code. You may also look at the following articles to learn more –
