Updated February 28, 2023
SUMX in Power BI
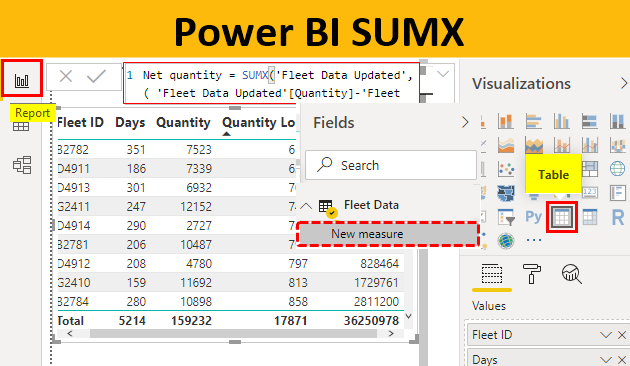
The SUMX function in Power BI facilitates the sum of products. So, it first performs product of the corresponding field values for each row and then adds them. In Power BI, the function can be implemented either through a measure or through a column. However, the implementation is meaningful when it is applied in a measure.
How to Implement the SUMX Function in Power BI?
In order to understand the concept of SUMX function in Power BI, we will go through a step by step procedure. For this demonstration, we are considering the Fleet dataset. The dataset contains data pertaining to average quantity supplied and a number of days operated in a year for various fleets. The important dimension here is Fleet id, while important measures are Quantity and Days. Using SUMX function, we intend to obtain the total quantity a fleet is accountable for in a year. Let’s go through the step-by-step procedure as given below.
To apply Power BI SUMX you need data to work with, so you can download the excel workbook template from the below link which is used for this example.
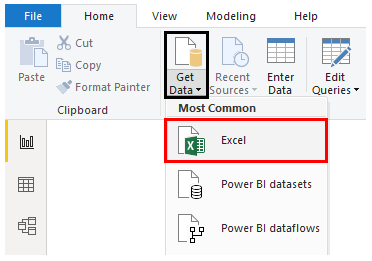
- Step 1: Now to create Parameters in Power BI, first we need to upload this data in Power BI. Go to the home menu and click on Get Data option to know the list of all the sources as shown below. As our data is in excel, so we will be selecting Excel.
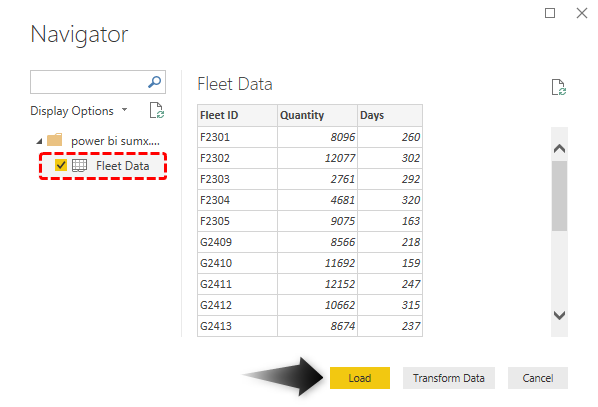
- Step 2: This will take us to browse window. Find the file and open it. From the navigator window, select the sheet which we want to use in Power BI and then click on Load.
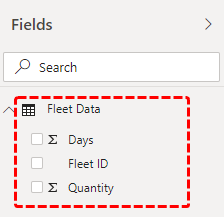
- Step 3: When the file successfully gets loaded into Power BI, the dimensions and measures present in it can be seen in the Fields section.
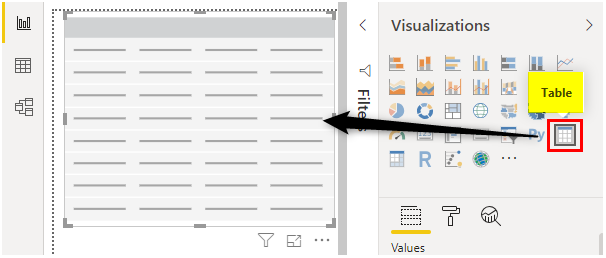
Step 4: Now, in the Visualizations section, click on the Table symbol highlighted by the red box.
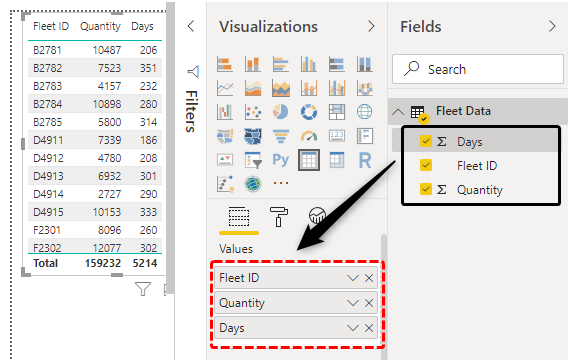
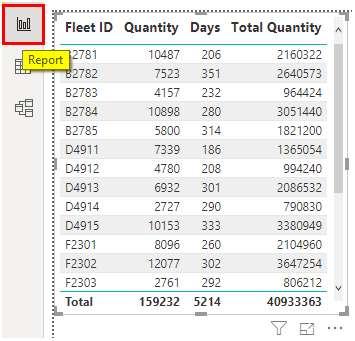
- Step 5: Next, in the Fields section, select all the fields viz. dimension Days, and measures Fleet ID and Quantity. When they are selected, a table gets created as can be seen on the left-hand side of the screenshot.
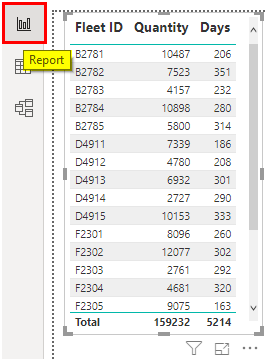
- Step 6: The text size in the table in the above screenshot is very small. To increase the size, select ‘Actual Size’ option (View -> Page View -> Actual Size). As a result, we get a table with fairly good text size.
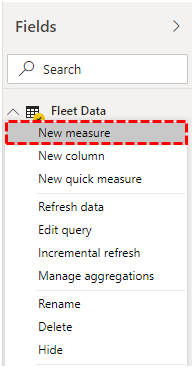
- Step 7: Now, we intend to bring the total quantity into the table. The total quantity will be the product of Quantity and Days measures. We want this for each fleet. This can be accomplished using the SUMX function. We first need to create a measure. So, click on ‘More options’ for the ‘Fleet Data’ table in the Fields section, and click on ‘New measure’.
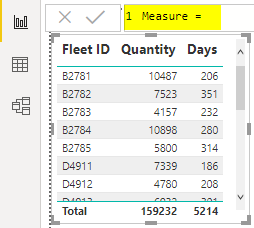
- Step 8: When we click on ‘New measure’, we are navigated to the Expressions bar. The default name of the measure is Measure.
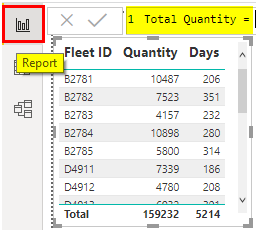
- Step 9: Change the name of the measure to Total Quantity as shown by the following screenshot.
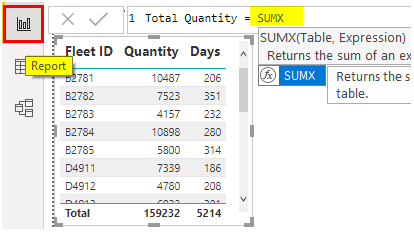
- Step 10: Just start typing sumx as shown below and Power BI automatically gives us detailed information pertaining to parameters etc.
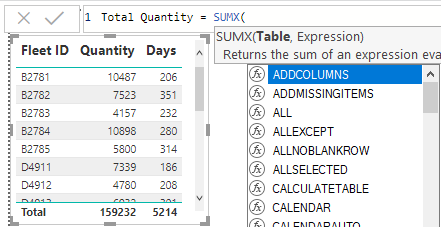
- Step 11: As we move inside the function, we find the Table as the first parameter. Mention here the name of the concerned table.
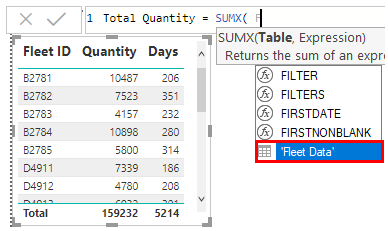
- Step 12: Now, in this case, we have only one table which is ‘Fleet Data’. So, just press f, and we find the table in the list. Move to the table name, and press ‘Enter’, it becomes the first parameter.
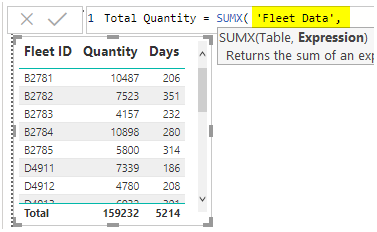
- Step 13: Once we are done with specifying the table name which is the first parameter in SUMX function, type comma, and the next parameter i.e. Expression gets activated. It is very important part of the SUMX function.
- Step 14: Observe carefully the Expression in the SUMX function in the following screenshot. Our expression is basically a product of Quantity and Days.
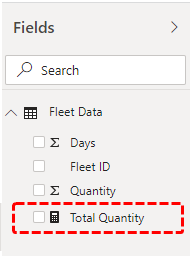
- Step 15: When the SUMX function is correctly implemented using the above steps, then the Total Quantity measure gets created as can be seen in the Fields section.
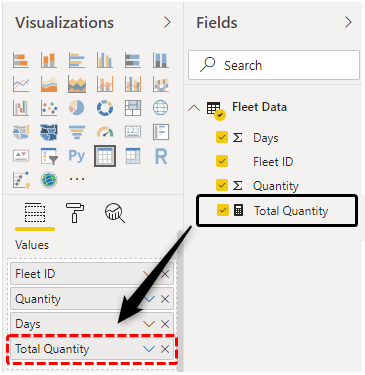
- Step 16: Select the Total Quantity, and the table gets created.
- Step 17: The following table gives a closer look into the Total Quantity. As we can see, the measure has successfully given the correct figures. This is because we performed SUMX over the measure. Had we performed it over the column, then for each Fleet ID, we would have got the total sum of the products as against the sum of products for each row.
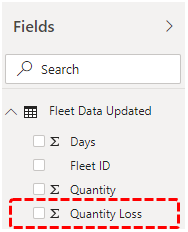
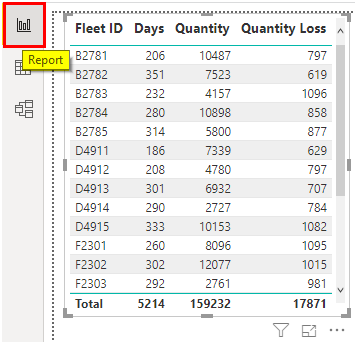
- Step 18: Now, another field ‘Quantity Loss’ gets added into the data source. This time the net quantity will have to take into consideration. The formula shall be the product of days and quantity excluding loss. Load the updated sheet “Fleet Data Updated”, by following the procedure mentioned in the above section. The following screenshot shows the updated dataset loaded into Power BI.
- Step 19: Have a look at the table after the ‘Quantity Loss’ field is brought into it as shown below.
- Step 20: As shown below, we implemented the SUMX expression to incorporate the impact of quantity loss.
- Step 21: Observe carefully the SUMX expression in the following screenshot. Just check how it works.
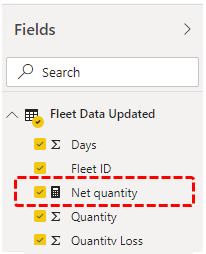
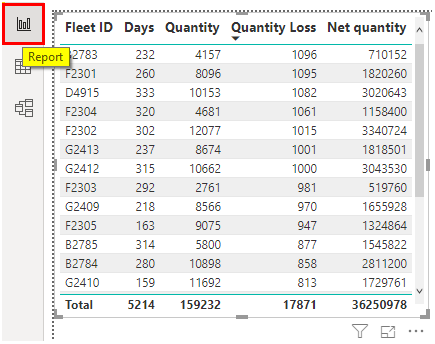
- Step 22: Now, in the Fields section, select Net Quantity.
The SUMX function does its work by giving us the correct result.
Note: To apply conditional formatting we need data, you can download the Power BI file to get the ready table.
Things to Remember
- The SUMX function should be implemented through measure and not through column, otherwise, the same result will be obtained for each row-to-row combination.
- SUMX is different from SUM because the SUM function just adds all the column values.
- Implementation of the SUMX function requires knowledge of DAX language.
Recommended Articles
This is a guide to Power BI SUMX. Here we discuss how to Implement the SUMX Function with an example and downloadable template. You may also look at the following articles to learn more –

