Updated March 28, 2023
Parameters in Power BI
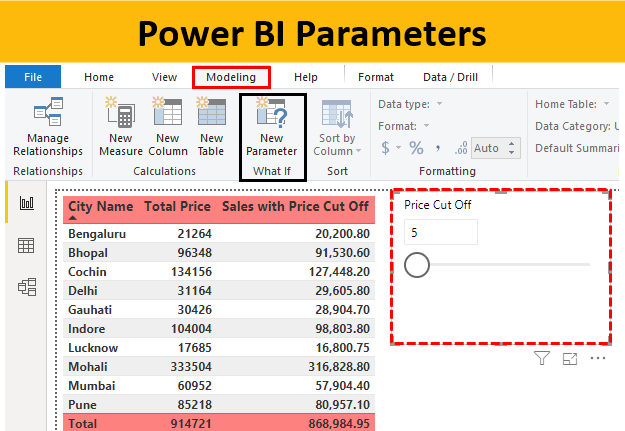
Parameters in Power BI are used to analyze different types of scenarios of the same outcome. We can use a parameter slicer in Power BI we can change the level of analysis either high or low to get the conclusion. It is like doing the What-If analysis in Excel. We can perform any kind of analysis in Power BI as we used to do in Excel, which is exactly based on What-If Analysis. To understand it better, let’s consider a data set of some populations and you want to analyze what is the percentage increase in Men and Women ratio on the basis of location and geographical condition. This seems a little tricky but with the help of population data, we can conclude something.
How to Use Parameters in Power BI?
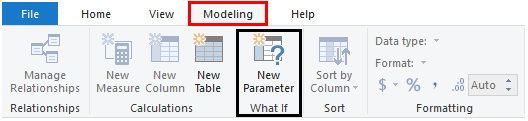
To access Parameters in Power BI, go to Modeling ribbon and under the What If section, select New Parameter as shown below.
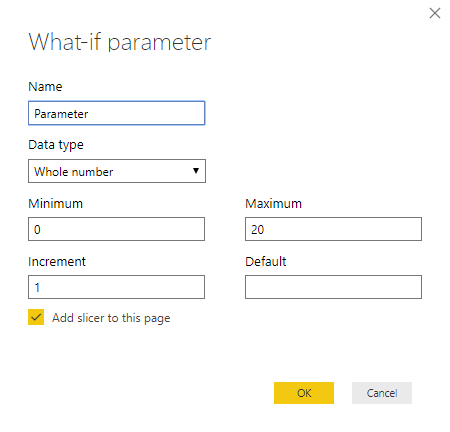
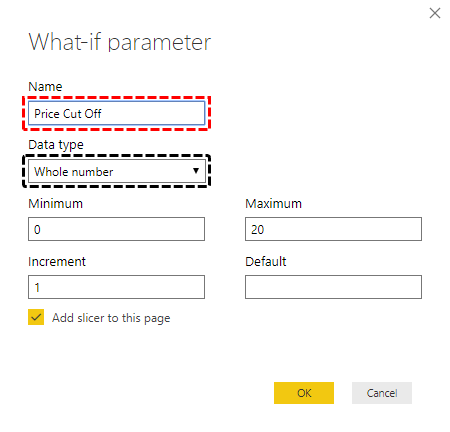
If we click on it, we will see the option What-If parameter as shown below. This is where most of the work for Parameters are done.
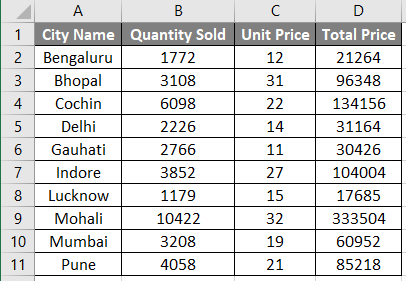
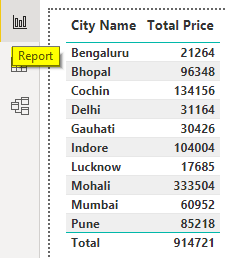
We have a table which contains Sales Data of Medicines. In the below table we have City names, quantity sold in those cities and price of the medicine. With the help of Parameters, we will calculate how much discount could be given to see the changes.
You can download the workbook used in this example to practice along with us from the below link.
In the following section, we will go through the detailed step-by-step process to create Parameters in Power BI.
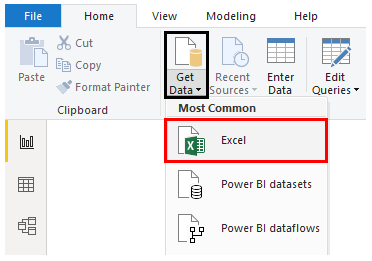
- Step 1: Now to create Parameters in Power BI, first we need to upload this data in Power BI. Go to the home menu ribbon and click on Get Data option to know the list of all the sources as shown below. As our data is in excel, so we will be selecting Excel.
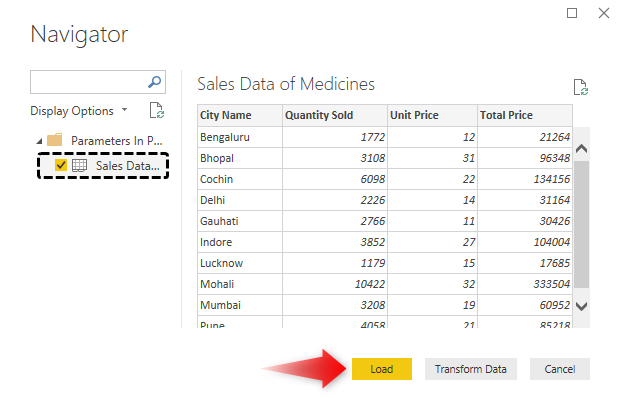
- Step 2: This will take us to browse window. Find the file and open it. From the navigator window, select the sheet which we want to use in Power BI and then click on Load.
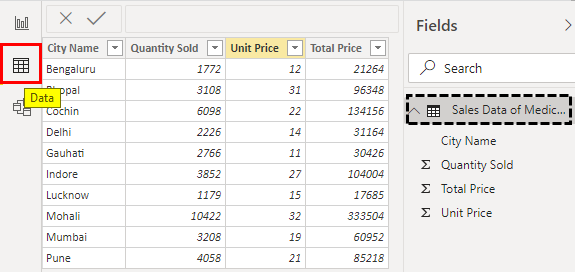
- Step 3: Once it is done, we will be able to see the loaded Data tab.
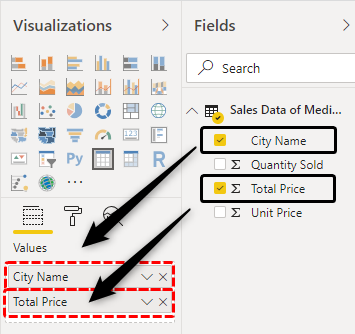
- Step 4: Now we will create a table which will show the city and the total sale of those cities. Select Table chart from visualization and drag city name and total price into values.
- Step 5: This will give us the Table in the Report tab.
- Step 6: Now we will create a Parameter to see what changes come if we allow to give some discount.
- Step 7: Name the parameter as per your choice. As we calculate the price cut off so here also we will be doing it in the same way and we will keep the data type as the Whole Number.
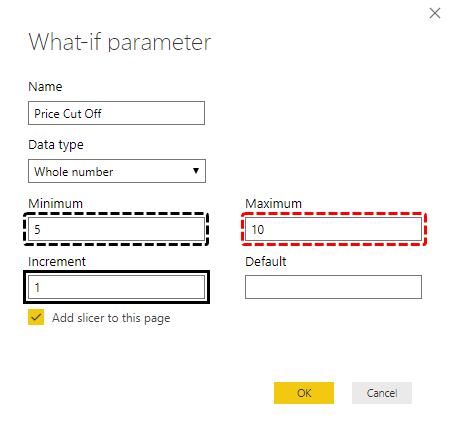
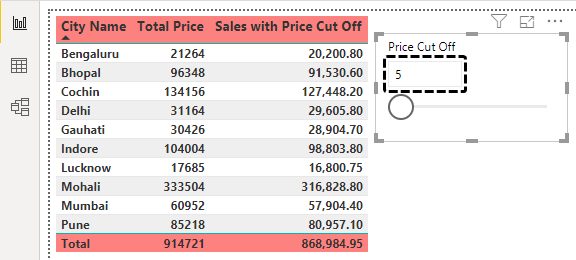
- Step 8: Suppose we want to cut the price in the range of 5-10%, then mention the same in the Minimum and Maximum section. And we will keep the Increment as 1. This is for getting 1 unit increment in Min and MAX values.
- Step 9: By clicking Ok, it will add a slicer in the Report page as shown below.
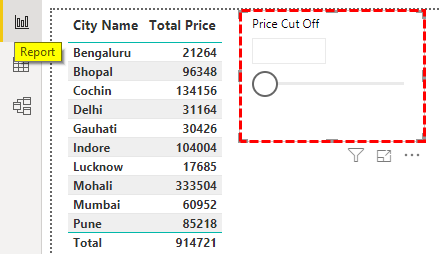
- Step 10: As the slicer is seen in the report page, we will see also see the Cut Off parameter fields.
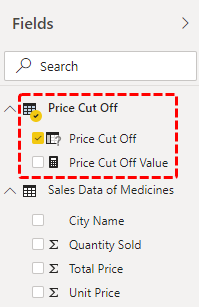
- Step 11: These two values are automatically created from DAX by GENERATESERIES and SELECTEDVALUE. To see the formula in created fields in Price Cut Off, just select it.
![]()
- Step 12: Where GENERATESERIES function syntax says minimum value for cut off is 5, maximum is 10 and incremental value is 1. Same it is with Price Cut off Value field as well.
![]()
- Step 13: Now we will create a new measure for a price cut off in Sales Table.
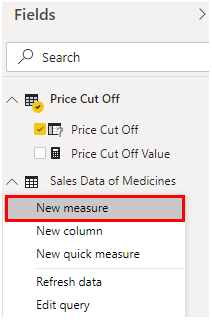
- Step 14: We will name it as Sale with Price Cut Off. You can choose any name here.
![]()
- Step 15: To get the Sales figure use SumX function. This is used to include a table as well when we have different tables to include.
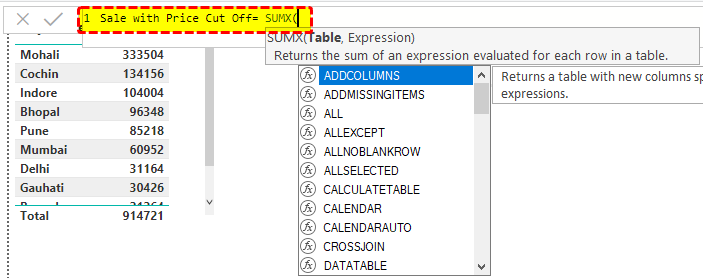
- Step 16: As per syntax, select the name of the table and the column which we need to include for a price cut off.
![]()
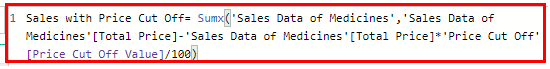
- Step 17: Further in the same formula, insert minus sign followed by the name Sales table’s Total Price.

- Step 18: We will include the Price Cut Off Value fields here from Price Cut Off and divide it by 100 in the form of a percent.
- Step 19: Now drag the created measure in Sales Table values.
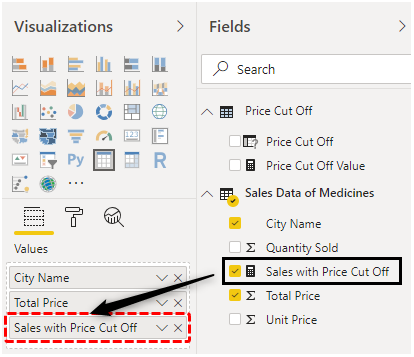
- Step 20: The table will look as shown below.
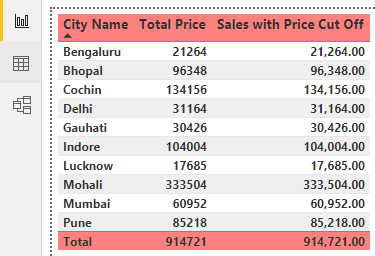
- Step 21: After some formatting, the table and pivot will look like as shown below.
- Step 22: Now to test the parameters which we have set in Price Cut Off, drag the bar Price Cut Off 7, to see what changes happen. As we can see, the price has been reduced 2 more percent after 5 which was the minimum criteria.
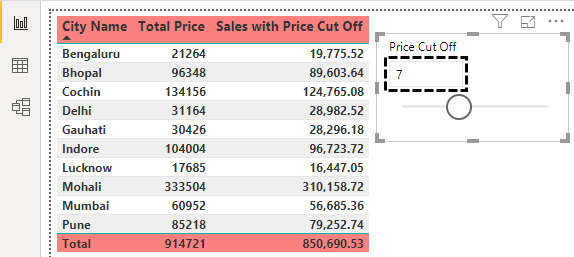
This is how Parameters in Power BI works.
Note: Power BI Parameters in the report file can also be downloaded from the link below and the final output can be viewed.
Pros of Parameter in Power BI:
- We can create any type of measure using Parameter.
- Doing the analysis with the help of Parameters gives multiple types of analysis results.
Things to Remember
- We can use DAX to create different calculation measures.
- While creating the new parameters or values, always use New Measure.
- We can change the Minimum, Maximum and incremental change whenever needed.
- Parameters in Power BI works on What-If analysis theory.
Recommended Articles
This is a guide to Power BI Parameters. Here we discuss how to use Parameters in Power BI with examples and downloadable template. You may also look at the following articles to learn more –
