Updated March 23, 2023
Introduction to Poisson Regression in R
Poisson Regression in R is a type of regression analysis model which is used for predictive analysis where there are multiple numbers of possible outcomes expected which are countable in numbers. R language provides built-in functions to calculate and evaluate the Poisson regression model. Poisson regression is useful to predict the value of the response variable Y by using one or more explanatory variable X. This is a preferred probability distribution which is of discrete type. One of the use cases of a Poisson regression model would be predicting the number of leads that will convert to customers within a particular time frame in an organization.
Implementing Poisson Regression
We’ll now proceed to understand how the model is applied. The following section gives a step-by-step procedure for the same. For this demonstration, we are considering the “gala” dataset from the “faraway” package. It pertains to the species diversity on the Galapagos Islands. There are altogether 7 variables in the dataset. We’ll use Poisson regression to define a relationship between the number of plant species (Species) with other variables in the dataset.
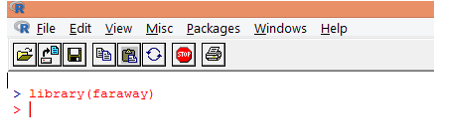
1. First load the “faraway” package. In case, the package is not present, download it using install.packages() function.
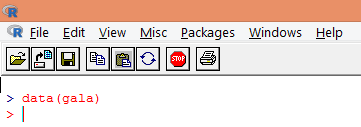
2. Once the package is loaded, load the “gala” dataset into R using data() function as shown below.
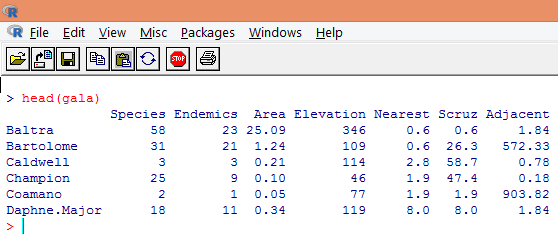
3. The loaded data should be visualized to study the variable and verify if there are any discrepancies. We can visualize either the entire data or just the first few rows of it using the head() function as shown in the below screenshot.
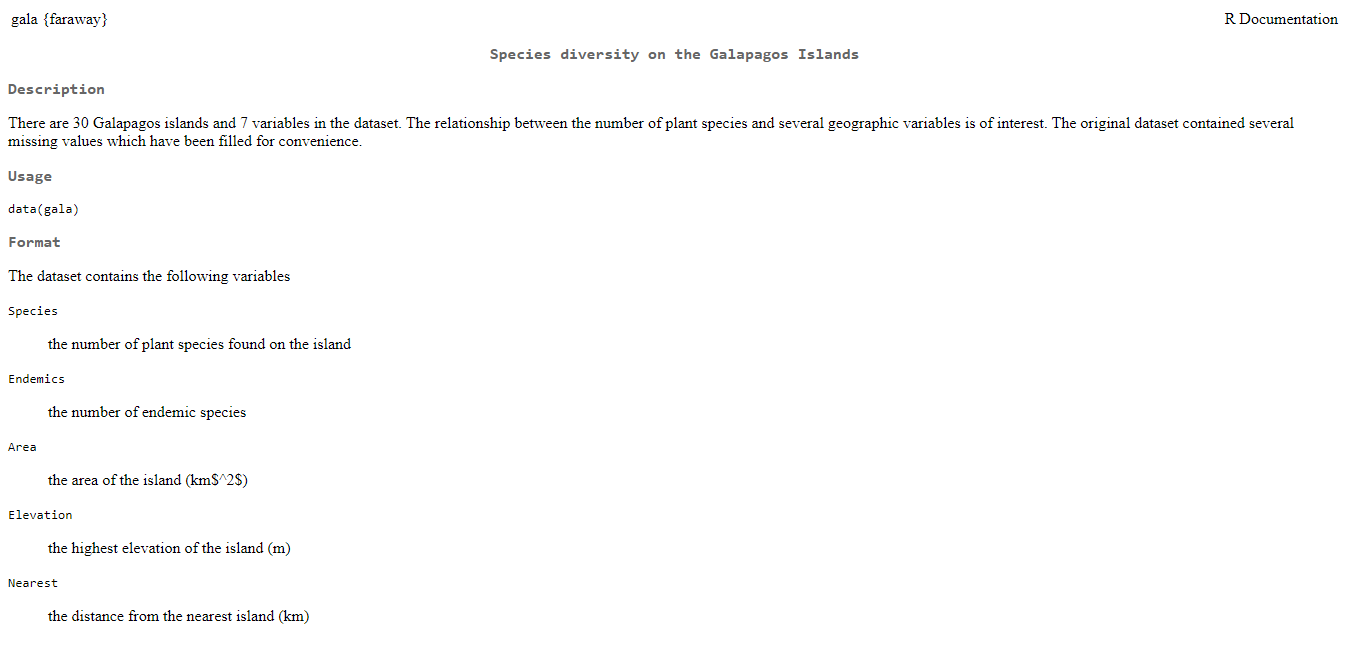
4. To get more insight into the dataset, we can use help functionality in R as below. It generates the R documentation as shown in the screenshot subsequent to the below screenshot.
5. If we study the dataset as mentioned in the preceding steps, then we can find that Species is a response variable. We’ll now study a basic summary of the predictor variables.
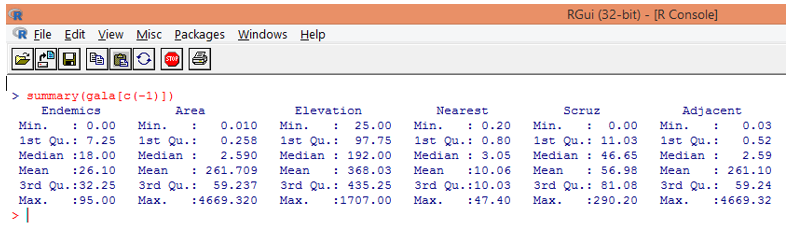
Note, as can be seen above, we have excluded the variable Species. The summary function gives us basic insights. Just observe the median values for each of these variables, and we can find that a huge difference, in terms of the range of values, exists between the first half and the second half, e.g. for Area variable median value is 2.59, but the maximum value is 4669.320.
6. Now that we are done with basic analysis, we’ll generate a histogram for Species in order to check if the variable follows the Poisson distribution. This is illustrated below.
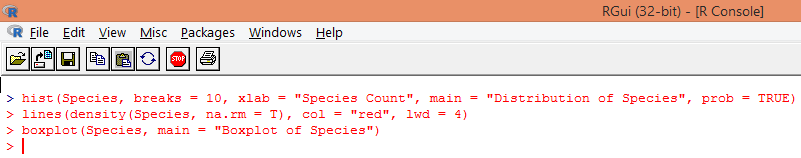
The above code generates a histogram for Species variable along with a density curve superimposed over it.
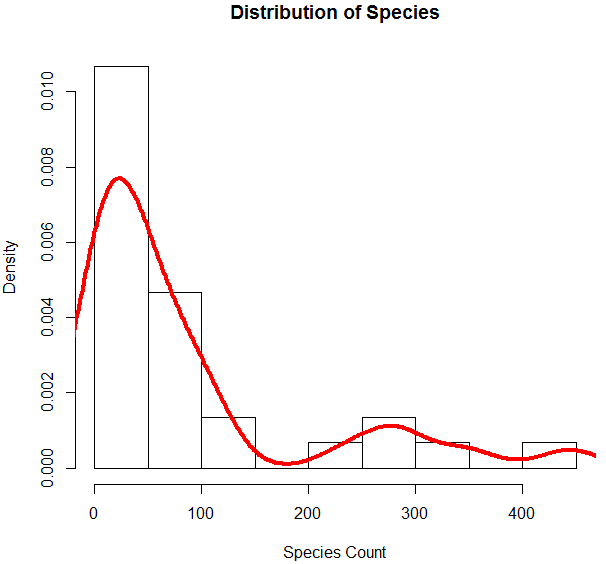
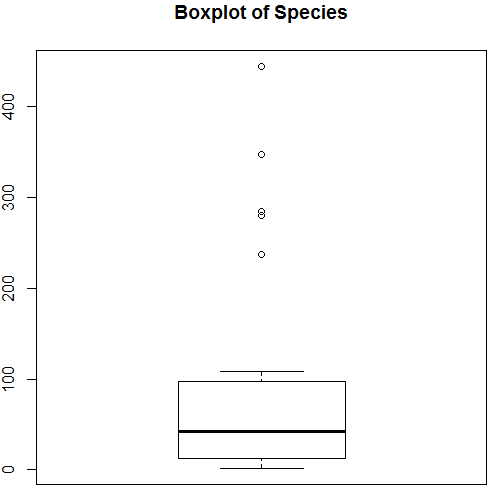
The above visualization shows that Species follows a Poisson distribution, as the data is right-skewed. We can generate a boxplot too, to get more insight into the distribution pattern as shown below.
7. Having done with the preliminary analysis, we’ll now apply Poisson regression as shown below
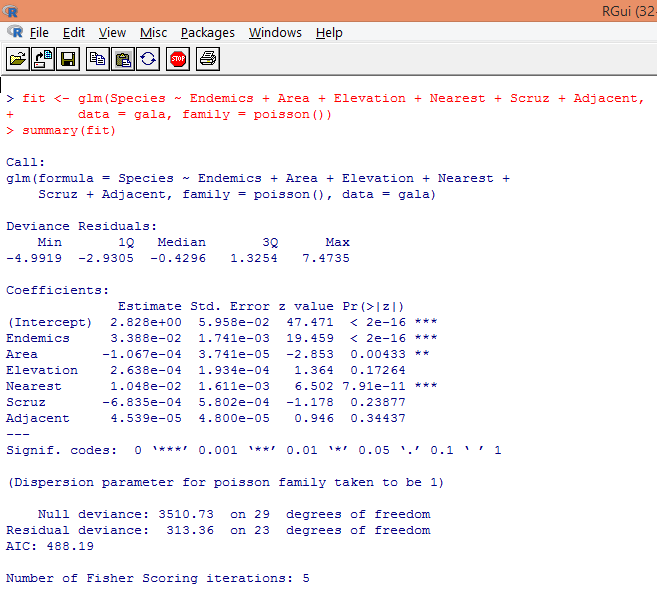
Based on the above analysis, we find that variables Endemics, Area, and Nearest are significant and only their inclusion is sufficient to build the right Poisson regression model.
8. We’ll build a modified Poisson regression model taking into consideration three variables only viz. Endemics, Area, and Nearest. Let’s see what results we get.
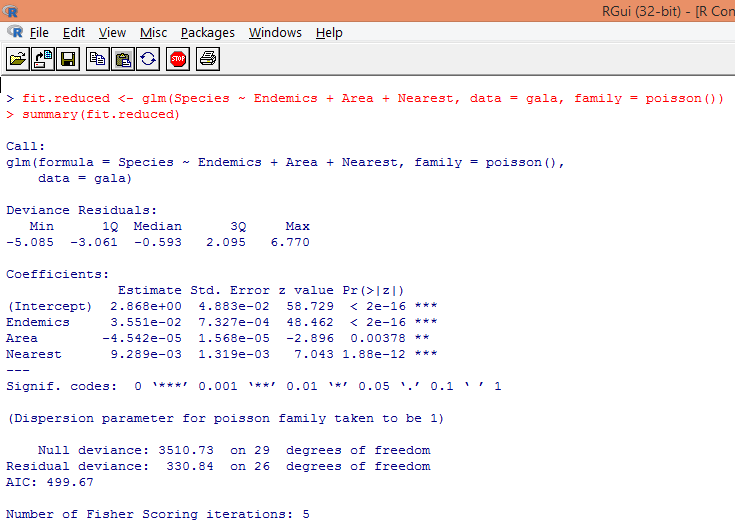
The output produces deviances, regression parameters, and standard errors. We can see that each of the parameters is significant at p < 0.05 level.
9. The next step is to interpret the model parameters. The model coefficients can be obtained either by examining Coefficients in the above output or by using coef() function.
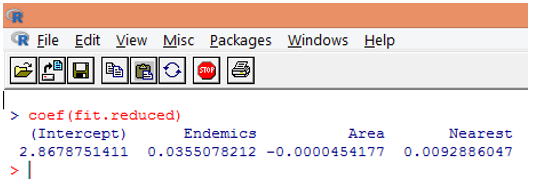
In Poisson regression, the dependent variable is modeled as the log of the conditional mean loge(l). The regression parameter of 0.0355 for Endemics indicates that a one-unit increase in the variable is associated with a 0.04 increase in the log mean number of Species, holding other variables constant. The intercept is a log mean number of Species when each of the predictors equals zero.
10. However, it is much easier to interpret the regression coefficients in the original scale of the dependent variable (number of Species, rather than log number of Species). The exponentiation of the coefficients will allow an easy interpretation. This is done as follows.
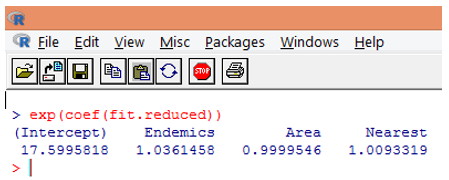
From the above findings, we can say that one unit increase in Area multiples the expected number of species by 0.9999, and a unit increase in the number of endemic species represented by Endemics multiplies the number of species by 1.0361. The most important aspect of Poisson regression is that exponentiated parameters have a multiplicative rather than an additive effect on the response variable.
11. Using the above steps, we obtained a Poisson regression model for predicting the number of plant species on the Galapagos Islands. However, it is very important to check for overdispersion. In Poisson regression, the variance and means are equal.
Overdispersion occurs when the observed variance of the response variable is larger than would be predicted by the Poisson distribution. Analyzing overdispersion becomes important as it is common with count data, and can negatively impact the final results. In R, overdispersion can be analyzed using the “qcc” package. The analysis is illustrated below.
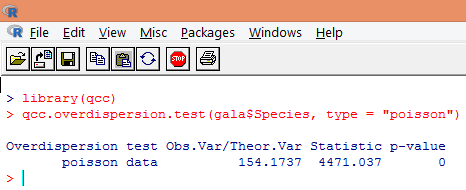
The above significant test shows that the p-value is less than 0.05, which strongly suggests the presence of overdispersion. We’ll try fitting a model using glm() function, by replacing family = “Poisson” with family = “quasipoisson”. This is illustrated below.
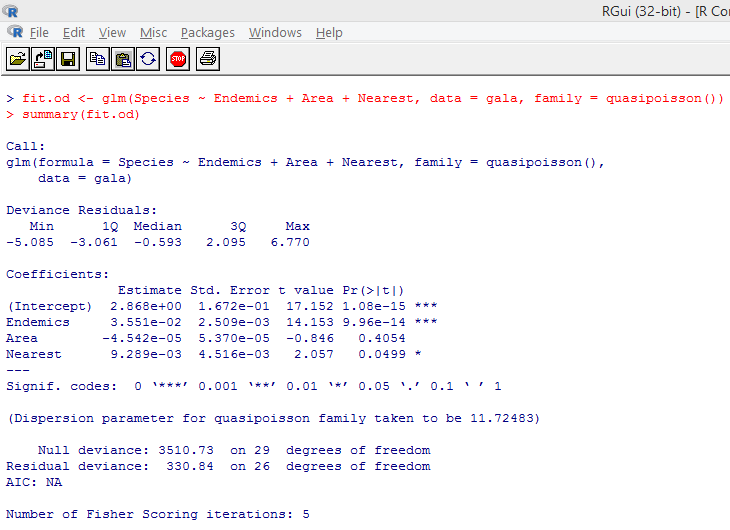
Closely studying the above output, we can see that the parameter estimates in the quasi-Poisson approach are identical to those produced by the Poisson approach, though the standard errors are different for both the approaches. Moreover, in this case, for Area, the p-value is greater than 0.05 which is due to larger standard error.
Importance of Poisson Regression
- Poisson Regression in R is useful for correct predictions of the discrete / count variable.
- It helps us identify those explanatory variables which have a statistically significant effect on the response variable.
- Poisson Regression in R is best suitable for events of “rare” nature as they tend to follow a Poisson distribution as against common events that usually follow a normal distribution.
- It is suitable for application in cases where the response variable is a small integer.
- It has wide applications, as a prediction of discrete variables is crucial in many situations. In medicine, it can be used to predict the impact of the drug on health. It is heavily used in survival analysis like the death of biological organisms, failure of mechanical systems, etc.
Conclusion
Poisson regression is based on the concept of Poisson distribution. It is another category belonging to the set of regression techniques that combines the properties of both Linear as well as Logistic regressions. However, unlike Logistic regression which generates only binary output, it is used to predict a discrete variable.
Recommended Articles
This is a guide to Poisson Regression in R. Here we discuss the introduction Implementing Poisson Regression and Importance of Poisson Regression. You can also go through our other suggested articles to learn more–
