EDUCBA

EDUCBA

MENUMENU
  • Free Tutorials
  • Free Courses
  • Certification Courses
  • 360+ Courses All in One Bundle
  • Login
Home Data Science Data Science Tutorials Head to Head Differences Tutorial Linear Regression vs Logistic Regression
Secondary Sidebar
Head to Head Differences Tutorial
  • Differences Tutorial
    • Scikit Learn vs TensorFlow
    • Azure Functions vs Logic Apps
    • Azure Data Factory vs Databricks
    • SHA1 vs MD5
    • Azure SQL Database vs Managed Instance
    • Azure SQL Database vs SQL Server
    • PostgreSQL vs MySQL
    • PostgreSQL vs MySQL Benchmark
    • ArangoDB vs MongoDB
    • Cloud Computing vs Big Data Analytics
    • T-SQL vs SQL
    • PostgreSQL vs MariaDB
    • Spark vs Impala
    • Datadog vs Splunk
    • Domo vs Tableau
    • Data Scientist vs Data Engineer vs Statistician
    • Big Data Vs Machine Learning
    • Predictive Analytics vs Business Intelligence
    • AI vs Machine Learning vs Deep Learning
    • Business Intelligence vs Data Warehouse
    • Apache Kafka vs Flume
    • Data Science vs Machine Learning
    • Business Analytics Vs Predictive Analytics
    • Data mining vs Web mining
    • Data Science Vs Data Mining
    • Data Science Vs Business Analytics
    • Analyst vs Associate
    • Apache Hive vs Apache Spark SQL
    • Apache Nifi vs Apache Spark
    • Apache Spark vs Apache Flink
    • Apache Storm vs Kafka
    • Artificial Intelligence vs Business Intelligence
    • Artificial Intelligence vs Human Intelligence
    • Al vs ML vs Deep Learning
    • SQL vs SQLite
    • Assembly Language vs Machine Language
    • AWS vs AZURE
    • AWS vs Azure vs Google Cloud
    • Big Data vs Data Mining
    • Big Data vs Data Science
    • Big Data vs Data Warehouse
    • Blu-Ray vs DVD
    • Business Intelligence vs Big Data
    • Business Intelligence vs Business Analytics
    • Business Intelligence vs Data analytics
    • Business Intelligence VS Data Mining
    • Business Intelligence vs Machine Learning
    • Business Process Re-Engineering vs CI
    • Cassandra vs Elasticsearch
    • Cassandra vs Redis
    • Cloud Computing Public vs Private
    • Cloud Computing vs Fog Computing
    • Cloud Computing vs Grid Computing
    • Cloud Computing vs Hadoop
    • Computer Network vs Data Communication
    • Computer Science vs Data Science
    • Computer Scientist vs Data Scientist
    • Customer Analytics vs Web Analytics
    • Data Analyst vs Data Scientist
    • Data Analytics vs Business Analytics
    • Data Analytics vs Data Analysis
    • Data Analytics Vs Predictive Analytics
    • Data Lake vs Data Warehouse
    • Data Mining Vs Data Visualization
    • Data mining vs Machine learning
    • Data Mining Vs Statistics
    • Data Mining vs Text Mining
    • Data Science vs Artificial Intelligence
    • Data science vs Business intelligence
    • Data Science Vs Data Engineering
    • Data Science vs Data Visualization
    • Data Science vs Software Engineering
    • Data Scientist vs Big Data
    • Data Scientist vs Business Analyst
    • Data Scientist vs Data Engineer
    • Data Scientist vs Data Mining
    • Data Scientist vs Machine Learning
    • Data Scientist vs Software Engineer
    • Data visualisation vs Data analytics
    • Data vs Information
    • Data Warehouse vs Data Mart
    • Data Warehouse vs Database
    • Data Warehouse vs Hadoop
    • Data Warehousing VS Data Mining
    • DBMS vs RDBMS
    • Deep Learning vs Machine learning
    • Digital Analytics vs Digital Marketing
    • Digital Ocean vs AWS
    • DOS vs Windows
    • ETL vs ELT
    • Small Data Vs Big Data
    • Apache Hadoop vs Apache Storm
    • Hadoop vs HBase
    • Between Data Science vs Web Development
    • Hadoop vs MapReduce
    • Hadoop Vs SQL
    • Google Analytics vs Mixpanel
    • Google Analytics Vs Piwik
    • Google Cloud vs AWS
    • Hadoop vs Apache Spark
    • Hadoop vs Cassandra
    • Hadoop vs Elasticsearch
    • Hadoop vs Hive
    • Hadoop vs MongoDB
    • HADOOP vs RDBMS
    • Hadoop vs Spark
    • Hadoop vs Splunk
    • Hadoop vs SQL Performance
    • Hadoop vs Teradata
    • HBase vs HDFS
    • Hive VS HUE
    • Hive vs Impala
    • JDBC vs ODBC
    • Kafka vs Kinesis
    • Kafka vs Spark
    • Cloud Computing vs Data Analytics
    • Data Mining Vs Data Analysis
    • Data Science vs Statistics
    • Big Data Vs Predictive Analytics
    • MapReduce vs Yarn
    • Hadoop vs Redshift
    • Looker vs Tableau
    • Machine Learning vs Artificial Intelligence
    • Machine Learning vs Neural Network
    • Machine Learning vs Predictive Analytics
    • Machine Learning vs Predictive Modelling
    • Machine Learning vs Statistics
    • MariaDB vs MySQL
    • Mathematica vs Matlab
    • Matlab vs Octave
    • MATLAB vs R
    • MongoDB vs Cassandra
    • MongoDB vs DynamoDB
    • MongoDB vs HBase
    • MongoDB vs Oracle
    • MongoDB vs Postgres
    • MongoDB vs PostgreSQL
    • MongoDB vs SQL
    • MongoDB vs SQL server
    • MS SQL vs MYSQL
    • MySQL vs MongoDB
    • MySQL vs MySQLi
    • MySQL vs NoSQL
    • MySQL vs SQL Server
    • MySQL vs SQLite
    • Neural Networks vs Deep Learning
    • PIG vs MapReduce
    • Pig vs Spark
    • PL SQL vs SQL
    • Power BI Dashboard vs Report
    • Power BI vs Excel
    • Power BI vs QlikView
    • Power BI vs SSRS
    • Power BI vs Tableau
    • Power BI vs Tableau vs Qlik
    • PowerShell vs Bash
    • PowerShell vs CMD
    • PowerShell vs Command Prompt
    • PowerShell vs Python
    • Predictive Analysis vs Forecasting
    • Predictive Analytics vs Data Mining
    • Predictive Analytics vs Data Science
    • Predictive Analytics vs Descriptive Analytics
    • Predictive Analytics vs Statistics
    • Predictive Modeling vs Predictive Analytics
    • Private Cloud vs Public Cloud
    • Regression vs ANOVA
    • Regression vs Classification
    • ROLAP vs MOLAP
    • ROLAP vs MOLAP vs HOLAP
    • Spark SQL vs Presto
    • Splunk vs Elastic Search
    • Splunk vs Nagios
    • Splunk vs Spark
    • Splunk vs Tableau
    • Spring Cloud vs Spring Boot
    • Spring vs Hibernate
    • Spring vs Spring Boot
    • Spring vs Struts
    • SQL Server vs PostgreSQL
    • Sqoop vs Flume
    • Statistics vs Machine learning
    • Supervised Learning vs Deep Learning
    • Supervised Learning vs Reinforcement Learning
    • Supervised Learning vs Unsupervised Learning
    • Tableau vs Domo
    • Tableau vs Microstrategy
    • Tableau vs Power BI vs QlikView
    • Tableau vs QlikView
    • Tableau vs Spotfire
    • Talend Vs Informatica PowerCenter
    • Talend vs Mulesoft
    • Talend vs Pentaho
    • Talend vs SSIS
    • TensorFlow vs Caffe
    • Tensorflow vs Pytorch
    • TensorFlow vs Spark
    • TeraData vs Oracle
    • Text Mining vs Natural Language Processing
    • Text Mining vs Text Analytics
    • Cloud Computing vs Virtualization
    • Unit Test vs Integration Test?
    • Universal analytics vs Google Analytics
    • Visual Analytics vs Tableau
    • R vs Python
    • R vs SPSS
    • Star Schema vs Snowflake Schema
    • DDL vs DML
    • R vs R Squared
    • ActiveMQ vs Kafka
    • TDM vs FDM
    • Linear Regression vs Logistic Regression
    • Slf4j vs Log4j
    • Redis vs Kafka
    • Travis vs Jenkins
    • Fact Table vs Dimension Table
    • OLTP vs OLAP
    • Openstack vs Virtualization
    • Cluster v/s Factor analysis
    • Informatica vs Datastage
    • CCBA vs CBAP
    • SPSS vs EXCEL
    • Excel vs Tableau
    • Cassandra vs MySQL
    • RabbitMQ vs Kafka
    • SAAS vs Cloud
    • RabbitMQ vs Redis
    • AMQP vs MQTT
    • Forward Chaining vs Backward Chaining
    • Google Data Studio vs Tableau
    • ActiveMQ vs RabbitMQ
    • Cloud vs Data Center
    • Cores vs Threads
    • Inner Join vs Outer Join
    • ZeroMQ vs Kafka
    • Mxnet vs TensorFlow
    • Redis vs Memcached
    • RDBMS vs NoSQL
    • AWS Direct Connect vs VPN
    • Cassandra vs Couchbase
    • Elegoo vs Arduino
    • Redis vs MongoDB
    • Chef vs Puppet
    • GSM vs GPRS
    • Keras vs TensorFlow vs PyTorch
    • Cloudflare vs CloudFront
    • Bitmap vs Vector
    • Left Join vs Right Join
    • IaaS vs PaaS
    • Blue Prism vs UiPath
    • GNSS vs GPS
    • Cloudflare vs Akamai
    • GCP vs AWS vs Azure
    • Arduino Mega vs Uno
    • Qualitative vs Quantitative Data
    • Arduino Micro vs Nano
    • PIC vs Arduino
    • PRTG vs Solarwinds
    • PostgreSQL vs SQLite
    • Metabase vs Tableau
    • Arduino Leonardo vs Uno
    • Arduino Due vs Mega
    • ETL Vs Database Testing
    • DBMS vs File System
    • CouchDB vs MongoDB
    • Arduino Nano vs Mini
    • IaaS vs PaaS vs SaaS
    • On-premise vs off-premise
    • Couchbase vs CouchDB
    • Tableau Dimension vs Measure
    • Cognos vs Tableau
    • Data vs Metadata
    • RethinkDB vs MongoDB
    • Cloudera vs Snowflake
    • HBase vs Cassandra
    • Business Analytics vs Business Intelligence
    • R Programming vs Python
    • MongoDB vs Hadoop
    • MySQL vs Oracle
    • OData vs GraphQL
    • Soft Computing vs Hard Computing
    • Binary Tree vs Binary Search Tree
    • Datadog vs CloudWatch
    • B tree vs Binary tree
    • Cloudera vs Hortonworks
    • DevSecOps vs DevOps
    • PostgreSQL Varchar vs Text
    • PostgreSQL Database vs schema
    • MapReduce vs spark
    • Hypervisor vs Docker
    • SciLab vs Octave
    • DocumentDB vs DynamoDB
    • PostgreSQL union vs union all
    • OrientDB vs Neo4j
    • Data visualization vs Business Intelligence
    • QlikView vs Qlik Sense
    • Neo4j vs MongoDB
    • Postgres Schema vs Database
    • Mxnet vs Pytorch
    • Naive Bayes vs Logistic Regression
    • Random Forest vs Decision Tree
    • Random Forest vs XGBoost
    • DynamoDB vs Cassandra
    • Looker vs Power BI
    • PostgreSQL vs RedShift
    • Presto vs Hive
    • Random forest vs Gradient boosting
    • Gradient boosting vs AdaBoost
    • Amazon rds vs Redshift
    • Bigquery vs Bigtable
    • Data Architect vs Data Engineer
    • DataSet vs DataTable
    • dataset vs dataframe
    • Dataset vs Database
    • New Relic vs Splunk
    • Data Architect and Management Designer
    • Data Engineer vs Data Analyst
    • Grafana vs Tableau
    • MySQL text vs Varchar
    • Relational Database vs Flat File
    • Datadog vs Prometheus
    • Neo4j vs Neptune
    • Data Mining vs Data warehousing
    • DocumentDB vs MongoDB
    • PostScript vs PCL
    • QRadar vs Splunk
    • Qlik Sense vs Tableau
    • DigitalOcean vs Google Cloud
    • PostgreSQL vs Elasticsearch
    • Redshift vs blueshift
    • Gitlab vs Azure DevOps

Related Courses

Online Data Science Course

Online Tableau Training

Azure Training Course

Hadoop Certification Course

Data Visualization Courses

All in One Data Science Course

Linear Regression vs Logistic Regression

By Priya PedamkarPriya Pedamkar

Linear-Regression-vs-Logistic-Regression

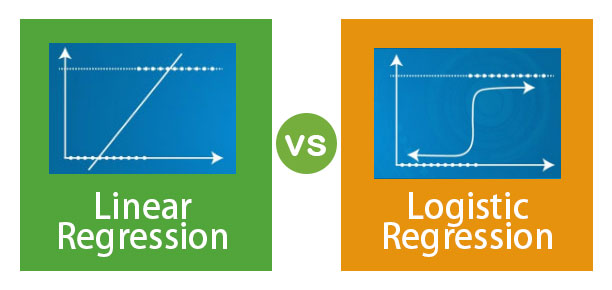
Difference Between Linear Regression and Logistic Regression

Linear regression is an algorithm that is based on the supervised learning domain of machine learning. It inherits a linear relationship between its input variables and the single output variable where the output variable is continuous in nature. It is used to predict the value of output let’s say Y from the inputs let’s say X. When only single input is considered it is called simple linear regression. Logistic Regression  is a form of regression which allows the prediction of discrete variables by a mixture of continuous and discrete predictors. It results in a unique transformation of dependent variables which impacts not only the estimation process but also the coefficients of independent variables. It addresses the same question which multiple regression does but with no distributional assumptions on the predictors. In logistic regression the outcome variable is binary. The purpose of the analysis is to assess the effects of multiple explanatory variables, which can be numeric or categorical or both.

Categories of Linear Regression

It can be classified into two main categories:

1. Simple Regression

Principal of operation: The main goal is to find out the equation of a straight line that best fits the sampled data. This equation algebraically describes the relationship between the two variables. The best-fitting straight line is called as regression line.

Y = β0 + β1 X

Start Your Free Data Science Course

Hadoop, Data Science, Statistics & others

Where,

All in One Data Science Bundle(360+ Courses, 50+ projects)
Python TutorialMachine LearningAWSArtificial Intelligence
TableauR ProgrammingPowerBIDeep Learning
Price
View Courses
360+ Online Courses | 50+ projects | 1500+ Hours | Verifiable Certificates | Lifetime Access
4.7 (86,171 ratings)

β represents the features

β0 represents the intercept

β1 represents the coefficient of feature X

2. Multivariable Regression

It is used to predict a correlation between more than one independent variable and one dependent variable. Regression with more than two independent variable is based on fitting shape to the constellation of data on a multi-dimensional graph. The shape of regression should be such that it minimizes the distance of the shape from every data point.

A linear relationship model can be represented mathematically as below:

Y = β0 + β1 X1 + β2X2 + β3X3 + ....... + βnXn 

Where,

β represents the features

β0 represents the intercept

β1 represents the coefficient of feature X1 

βn represents the coefficient of feature Xn

Advantages and Disadvantages of Linear Regression

Below given are advantages and disadvantages:

Advantages

  • Due to its simplicity, it is widely used modeling for predictions and inferences.
  • It focuses on data analysis and data preprocessing. So, it deals with different data without bothering about the details of the model.

Disadvantages

  • It works efficiently when the data are normally distributed. Thus for efficient modeling, the collinearity must be avoided.

Types of Logistic Regression

Below are the 2 types of Logistic Regression:

1. Binary Logistic Regression

It is used when the dependent variable is dichotomous i.e. like a tree with two branches. It is used when the dependent variable is non-parametric.

Used when

  • If there is no linearity
  • There are only two levels of the dependent variable.
  • If multivariate normality is doubtful.

 2. Multinomial Logistic Regression

Multinomial logistic regression analysis requires that the independent variables be metric or dichotomous. It does not make any assumptions of linearity, normality, and homogeneity of variance for the independent variables.

It is used when the dependent variable has more than two categories. It is used to analyze relationships between a non-metric dependent variable and metric or dichotomous independent variables, then compares multiple groups through a combination of binary logistic regressions. In the end, it provides a set of coefficients for each of the two comparisons. The coefficients for the reference group are taken to be all zeros. Finally, prediction is done based on the highest resultant probability.

Advantage of logistic regression: It is a very efficient and widely used technique as it doesn’t require many computational resources and doesn’t require any tuning.

Disadvantage of logistic regression: It cannot be used for solving non-linear problems.

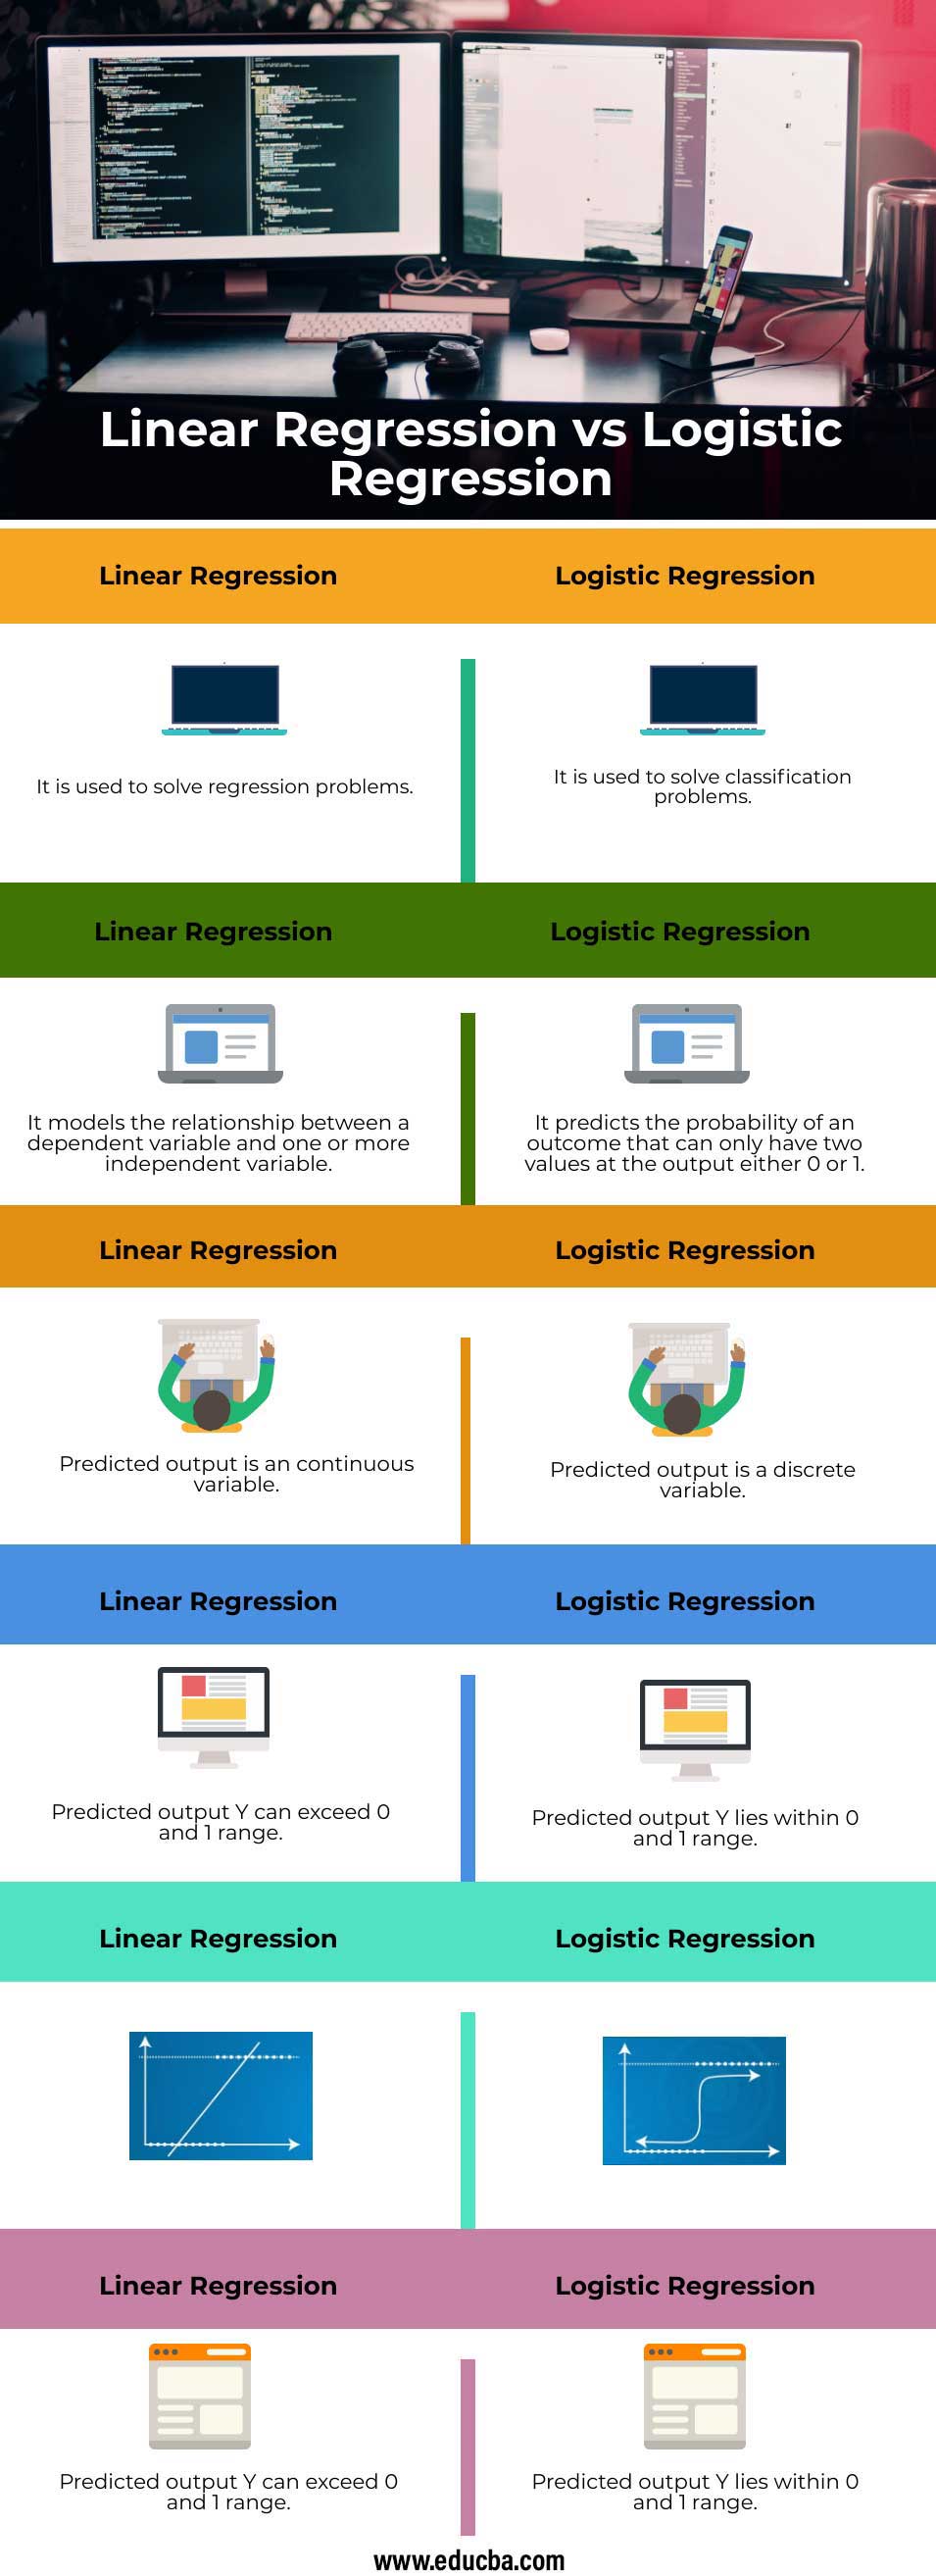
Head to Head comparison between Linear Regression and Logistic Regression (Infographics)

Below are the top 6 differences between Linear Regression vs Logistic Regression

Linear-Regression-vs-Logistic-Regression-info

Key Difference Between The Linear Regression and Logistic Regression

Let us discuss some of the major key differences between Linear Regression vs Logistic Regression

Linear Regression

  • It is a linear approach
  • It uses a straight line
  • It can’t take categorical variables
  • It has to ignore observations with missing values of the numeric independent variable
  • Output Y is given as

Linear Regression

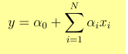
  • 1 unit increase in x increases Y by α

Applications

  • Predicting the price of a product
  • Predicting score in a match

Logistic Regression

  • It is a statistical approach
  • It uses a sigmoid function
  • It can take categorical variables
  • It can take decisions even if observations with missing values are present
  • Output Y is given as, where z is given as

Logistic Regression

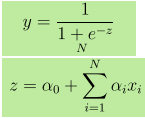
  • 1 unit increase in x increases Y by log odds of α
  • If P is the probability of an event, then (1-P) is the probability of it not occurring. Odds of success = P / 1-P

Applications

  • Predicting whether today it will rain or not.
  • Predicting whether an email is a spam or not.

Linear Regression vs Logistic Regression Comparison Table

Let’s discuss the top comparison between Linear Regression vs Logistic Regression

Linear Regression

Logistic Regression

It is used to solve regression problems It is used to solve classification problems
It models the relationship between a dependent variable and one or more independent variable It predicts the probability of an outcome that can only have two values at the output either 0 or 1
The predicted output is a continuous variable The predicted output is a discrete variable
Predicted output Y can exceed 0 and 1 range Predicted output Y lies within 0 and 1 range
regression 1 regression 2
Predicted output Y can exceed 0 and 1 range Predicted output

Conclusion

If features doesn’t contribute to prediction or if they are very much correlated with each other then it adds noise to the model. So, features which doesn’t contribute enough to the model must be removed. If independent variables are highly correlated it may cause a problem of multi-collinearity, which can be solved by running separate models with each independent variable.

Recommended Articles

This has been a guide to Linear Regression vs Logistic Regression . Here we discuss the Linear Regression vs Logistic Regression key differences with infographics, and comparison table. You may also have a look at the following articles to learn more–

  1. Data Science vs Data Visualization
  2. Machine Learning vs Neural Network
  3. Supervised Learning vs Deep Learning
  4. Logistic Regression in R
Popular Course in this category
Statistical Analysis Training (15 Courses, 10+ Projects)
  15 Online Courses |  10 Hands-on Projects |  140+ Hours |  Verifiable Certificate of Completion
4.5
Price

View Course

Related Courses

Data Scientist Training (85 Courses, 67+ Projects)4.9
Tableau Training (8 Courses, 8+ Projects)4.8
Azure Training (6 Courses, 5 Projects, 4 Quizzes)4.7
Hadoop Training Program (20 Courses, 14+ Projects, 4 Quizzes)4.7
Data Visualization Training (15 Courses, 5+ Projects)4.7
All in One Data Science Bundle (360+ Courses, 50+ projects)4.7
1 Shares
Share
Tweet
Share
Primary Sidebar
Footer
About Us
  • Blog
  • Who is EDUCBA?
  • Sign Up
  • Live Classes
  • Corporate Training
  • Certificate from Top Institutions
  • Contact Us
  • Verifiable Certificate
  • Reviews
  • Terms and Conditions
  • Privacy Policy
  •  
Apps
  • iPhone & iPad
  • Android
Resources
  • Free Courses
  • Database Management
  • Machine Learning
  • All Tutorials
Certification Courses
  • All Courses
  • Data Science Course - All in One Bundle
  • Machine Learning Course
  • Hadoop Certification Training
  • Cloud Computing Training Course
  • R Programming Course
  • AWS Training Course
  • SAS Training Course

ISO 10004:2018 & ISO 9001:2015 Certified

© 2022 - EDUCBA. ALL RIGHTS RESERVED. THE CERTIFICATION NAMES ARE THE TRADEMARKS OF THEIR RESPECTIVE OWNERS.

EDUCBA
Free Data Science Course

SPSS, Data visualization with Python, Matplotlib Library, Seaborn Package

*Please provide your correct email id. Login details for this Free course will be emailed to you

By signing up, you agree to our Terms of Use and Privacy Policy.

EDUCBA Login

Forgot Password?

By signing up, you agree to our Terms of Use and Privacy Policy.

EDUCBA
Free Data Science Course

Hadoop, Data Science, Statistics & others

*Please provide your correct email id. Login details for this Free course will be emailed to you

By signing up, you agree to our Terms of Use and Privacy Policy.

EDUCBA

*Please provide your correct email id. Login details for this Free course will be emailed to you

By signing up, you agree to our Terms of Use and Privacy Policy.

Let’s Get Started

By signing up, you agree to our Terms of Use and Privacy Policy.

This website or its third-party tools use cookies, which are necessary to its functioning and required to achieve the purposes illustrated in the cookie policy. By closing this banner, scrolling this page, clicking a link or continuing to browse otherwise, you agree to our Privacy Policy

Loading . . .
Quiz
Question:

Answer:

Quiz Result
Total QuestionsCorrect AnswersWrong AnswersPercentage

Explore 1000+ varieties of Mock tests View more