Regression Formula (Table of Contents)
What is Regression Formula?
Regression is used in statistical modeling, and it basically tells us the relationship between variables and their movement in the future, apart from statistical methods like standard deviation, regression, correlation.
The regression analysis is the most widely and commonly accepted measure to measure the variance in the industry. These relationships are seldom exact because there is variation caused by many variables, not just the variables being studied. The method is widely used in the industry for predictive modeling and forecasting measures. Regression tells us the relationship of the independent variable on the dependent variable and to explore the forms of these relationships.
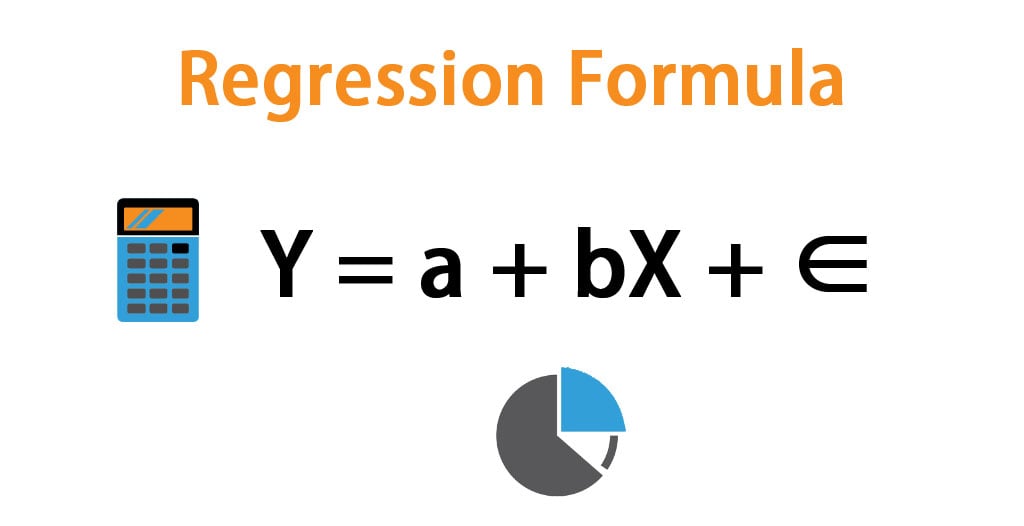
The formula for Regression Analysis –
- Y = Stands for the dependent variable
- X = Stands for an independent variable
- a = Stands for the intercept
- b = Stands for the slope
- ∈ = Stands for the error term
The formula for intercept “a” and the slope “b” can be calculated as per below.
Regression analysis is one of the most powerful multivariate statistical technique as the user can interpret parameters the slope and the intercept of the functions that link with two or more variables in a given set of data.
There are two types of regression multilinear regression and simple linear regression. The simple linear regression is explained and is the same as above. Whereas multilinear regression can be denoted as
Y = a + bX1 + cX2 + dX3 + ∈
Where,
- Y – Dependent variable
- X1, X2, X3 – Independent (explanatory) variables
- a – Intercept
- b, c, d – Slopes
- ϵ – Residual (error)
Examples of Regression Formula (With Excel Template)
Let’s take an example to understand the calculation of the Regression Formula in a better manner.
Regression Formula – Example #1
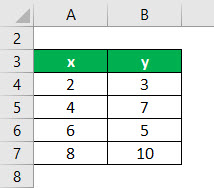
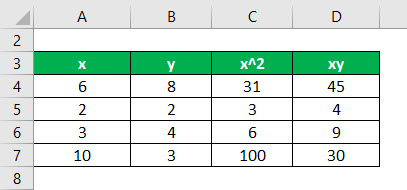
The following data set is given. You need to calculate the linear regression line of the data set.
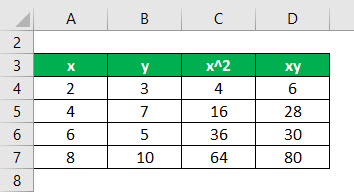
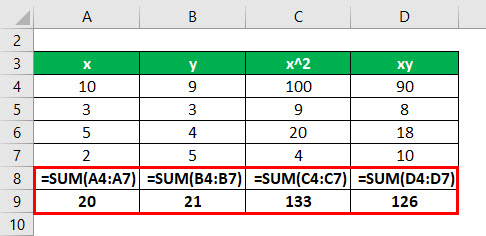
First, calculate the square of x and product of x and y
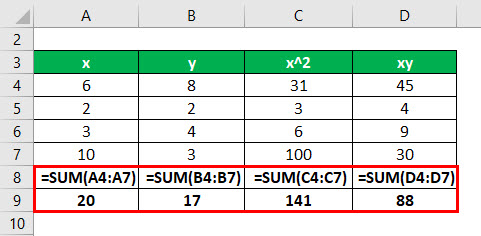
Calculate the sum of x, y, x2, and xy
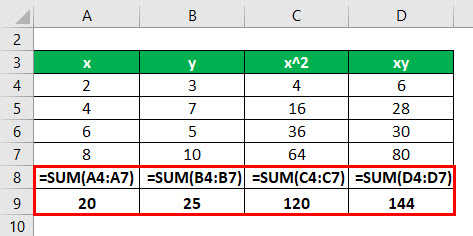
We have all the values in the above table with n = 4.
Now, first calculate the intercept and slope for the regression equation.
a (Intercept) is calculated using the formula given below
a = (((Σy) * (Σx2)) – ((Σx) * (Σxy))) / n * (Σx2) – (Σx)2
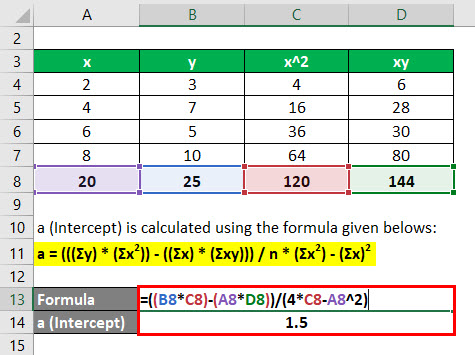
- a = ((25 * 120) – (20 * 144)) / (4*120 – (20)2)
- a = 1.5
b (Slope) is calculated using the formula given below
b = ((n * (Σxy)) – ((Σx) * (Σy))) / (n * (Σx2)) – (Σx)2
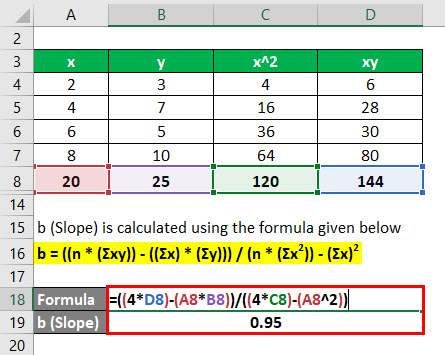
- b = ((4 * 144) – (20 * 25)) / (4*120 – (20)2)
- b = 0.95
So the regression line can be defined as Y = a +bX which is Y = 1.5 + 0.95 * X
Explanation
- x here is an independent variable, and y is the dependent variable which changes with the change in the value of x by a certain value.
- 1.5 is the intercept which can be defined as the value which remains constant irrespective of the changes in the independent variable.
- 0.95 in the equation is the slope of the linear regression, which defines how much of the variable is the dependent variable on the independent variable.
Regression Formula – Example #2
The following data set is given. You need to calculate the linear regression line of the data set.
First, calculate the square of x and product of x and y
Calculate the sum of x, y, x2, and xy
We have all the values in the above table with n = 4.
Now, first, calculate the intercept and slope for the regression equation.
a (Intercept) is calculated using the formula given below
a = (((Σy) * (Σx2)) – ((Σx) * (Σxy))) / n * (Σx2) – (Σx)2
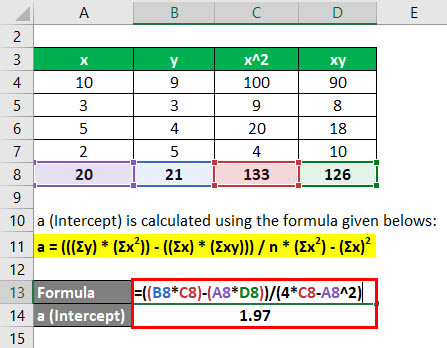
- a = ((21 * 133) – (20 * 126)) / (4 * 133 – (20)2)
- a = 1.97
b (Slope) is calculated using the formula given below
b = ((n * (Σxy)) – ((Σx) * (Σy))) / (n * (Σx2)) – (Σx)2
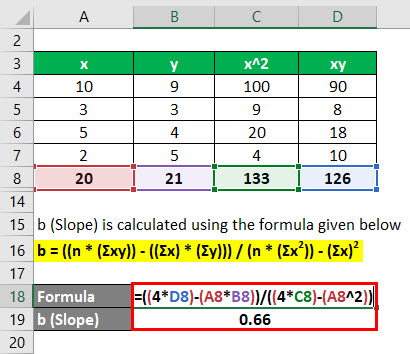
- b = ((4 * 126) – (20 * 21)) / (4*133 – (20)2)
- b = 0.66
So the regression line can be defined as Y = a +bX which is Y = 1.97 + 0.66 * X
Explanation
1.97 is the intercept which can be defined as the value which remains constant irrespective of the changes in the independent variable.
0.66 in the equation is the slope of the linear regression, which defines how much of the variable is the dependent variable on the independent variable.
Regression Formula – Example #3
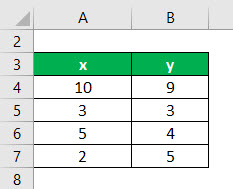
The following data set is given. You need to calculate the linear regression line of the data set.
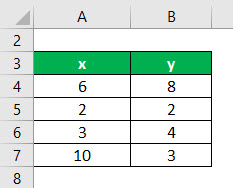
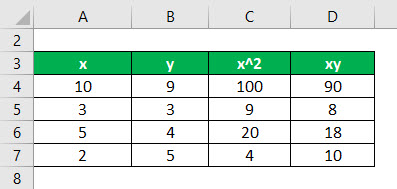
First, calculate the square of x and product of x and y
Calculate the sum of x, y, x2, and xy
We have all the values in the above table with n = 4.
Now, first, calculate the intercept and slope for the regression equation.
a (Intercept) is calculated using the formula given below
a = (((Σy) * (Σx2)) – ((Σx) * (Σxy))) / n * (Σx2) – (Σx)2
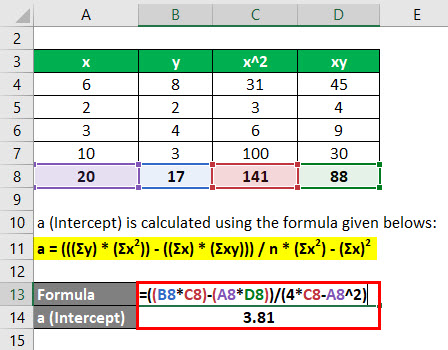
- a = ((17 * 141) – (20 * 88)) / (4 * 141 – (20)2)
- a = 3.81
b (Slope) is calculated using the formula given below
b = ((n * (Σxy)) – ((Σx) * (Σy))) / (n * (Σx2)) – (Σx)2
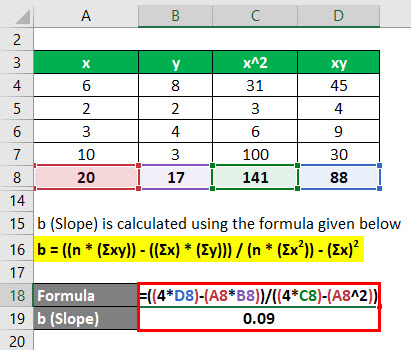
- b = ((4 * 88) – (20 * 17)) / (4 * 141 – (20)2)
- b = 0.09
So the regression line can be defined as Y = a +bX which is Y = 3.81 + 0.09 * X
Explanation
3.81 is the intercept which can be defined as the value which remains constant irrespective of the changes in the independent variable
0.09 in the equation is the slope of the linear regression, which defines how much of the variable is the dependent variable on the independent variable
Explanation
The regression formula has one independent variable and one dependent variable in the formula, and the value of one variable is derived with the help of the value of another variable. A slope calculator can be used to determine the rate of change between the variables, making it easier to analyze their relationship accurately.
Relevance and Uses of Regression Formula
The relevance and the use of regression formula can be used in a variety of fields. The relevance and importance of the regression formula are given below:
- In the field of finance, the regression formula is used to calculate the beta, which is used in the CAPM model to determine the cost of equity in the company. The cost of equity is used in the equity research and to provide valuations of the company.
- Regression is also used in forecasting the revenue and expense of the company; it may be useful to do multiple regression analysis to determine how the alterations of the assumptions mentioned will impact the revenue or the expense in the future of the company. For example, there may be a very high correlation between the number of salespeople employed by a company, the number of stores they operate, and the revenue the business generates.
- In statistics, the regression line is used widely to determine the t-statistics. If the slope is significantly different than zero, then we can use the regression model to predict the dependent variable for any value of the independent variable.
Recommended Articles
This has been a guide to the Regression formula. Here we discuss how to calculate Regression along with practical examples and a downloadable excel template. You may also look at the following articles to learn more –
