Updated July 29, 2023
PEG Ratio Formula (Table of Contents)
PEG Ratio Formula
One of the easiest and quick way to see if a company is over or undervalued, compare its Price to Earnings (P/E) ratio with the P/E ratio of market and peers.
If stock’s P/E ratio is greater than the market, the stock is more expensive and vice versa. But what if that company is growing at a much higher pace than the market. P/E ratio does not take into account the growth of the company and this is where PEG ratio, also known as Price Earnings to Growth ratio, comes into the picture. PEG ratio adjust the P/E ratio by taking into account the growth rate of the company and it is calculated by dividing the company’s P/E with its growth rate.
We can say that the PEG ratio is an improved version of the P/E ratio as it also factors in the growth rate along with P/E ratio. P/E ratio alone will only tell us about the attractiveness of a stock today but it does not take into consideration the future growth rate and attractiveness of the stock.
Now we have said that PEG is an improved version of the P/E ratio, it doesn’t necessarily mean that the P/E ratio is of no use. Each ratio has its own significance and it is important to look at all the relevant ratio while analyzing the performance of the company
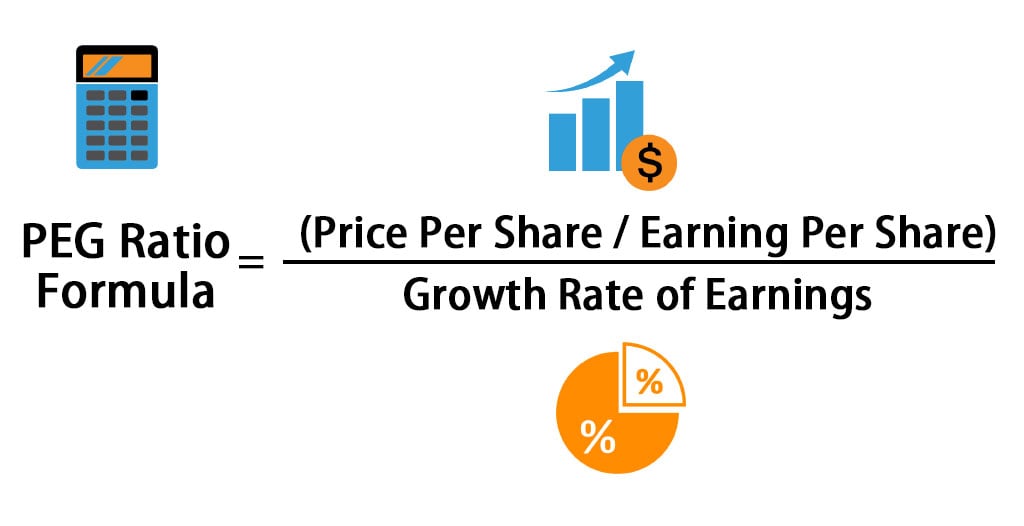
The formula for PEG Ratio
P/E ratio is relatively easy to calculate but we must be careful while determining the growth rate as it is not very simple as it seems. The problem here is that what growth rate shall we use, historical rate or expected future growth rate. So different investors will have different assumptions while calculating the growth rate which in turn cause a difference in calculated PEG ratio.
Examples of PEG Ratio Formula (With Excel Template)
Let’s take an example to understand the calculation of the PEG Ratio formula in a better manner.
PEG Ratio Formula – Example #1
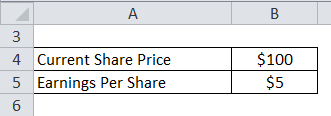
Consider a retail company X’s stock which is currently trading at say $100 per share in the market and its earnings per share (EPS) for the recent period is $5 per share.
P/E Ratio is calculated using the formula given below
P/E Ratio = Price Per share / Earning Per Share
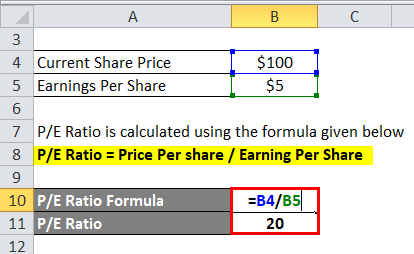
- P/E Ratio = $100 / $5
- P/E Ratio = 20
Since the P/E ratio is high, this stock will be considered as an expensive stock. But let’s say that this company is experiencing high growth period and next year earnings growth forecast is 50%.So
PEG Ratio is calculated using the formula given below
PEG Ratio = P/E Ratio / Growth Rate of Earnings
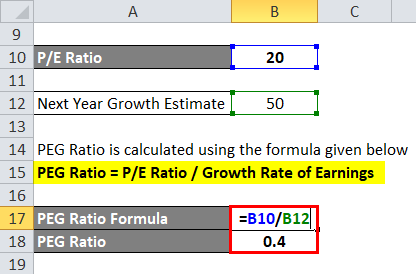
- PEG ratio = 20 / 50
- PEG Ratio = 0.4
A general rule of thumb is that if the PEG ratio is below 1.0, it is considered to be good. So even though X’s stock looks overvalued based on P/E ratio, the PEG ratio tells us that it is undervalued if we take into consideration its growth potential
PEG Ratio Formula – Example #2
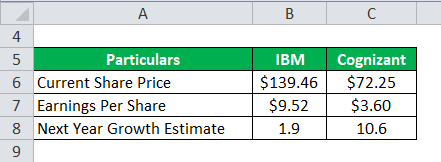
Now let see some practical example. I have taken two companies here IBM and Cognizant. Both are IT companies providing IT services and solution to their client. Below is the extract of their financial statements to calculate the PEG Ratio
P/E Ratio is calculated using the formula given below
P/E Ratio = Price Per share / Earning Per Share
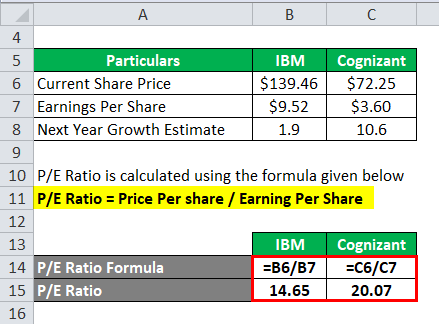
P/E Ratio of IBM
- P/E Ratio = $139.46 / $9.52
- P/E Ratio = 14.65
P/E Ratio of Cognizant
- P/E Ratio = $72.25 / $3.60
- P/E Ratio = 20.07
PEG Ratio is calculated using the formula given below
PEG Ratio = P/E Ratio / Growth Rate of Earnings
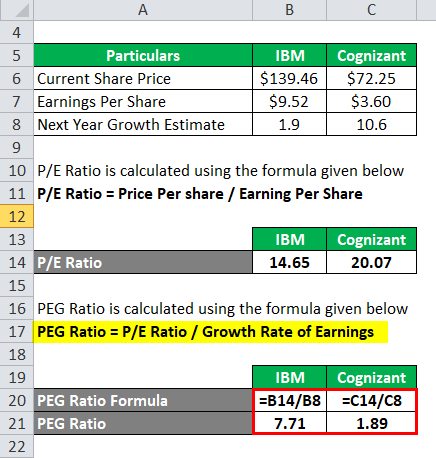
PEG Ratio of IBM
- PEG Ratio = 14.65 / 1.9
- PEG Ratio = 7.71
PEG Ratio of Cognizant
- PEG Ratio = 20.07 / 10.6
- PEG Ratio = 1.89
If you see here, the P/E ratio of Cognizant is higher than IBM. So if we only consider P/E parameter, Cognizant will be categorized as overvalued than IBM. But Cognizant is experiencing higher growth than IBM and is expected to grow by 10.6% whereas IBM is only expected to grow by 1.9%. So if we calculate their PEG ratio, Cognizant will be cheaper than IBM. Although both have PEG > 1, if we have to select a stock among these two, we will go for Cognizant based on PEG ratio.
Explanation of PEG Ratio Formula
As discussed above, the lower the PEG ratio, the more the stock may be undervalued considering its future growth expectations. But calculating the growth expectation is difficult task altogether. Based on different ways of calculating the growth rate, there are two ways to calculate the PEG ratio:
Forward PEG
In this, the forward-looking growth rate is used. Future growth expectation is taken into consideration while deriving this number. This may be the case that different analysts take different assumptions and can end up with different PEG ratios.
Trailing PEG
This method takes into consideration the historical growth rates of the company. This growth rate can be calculated by taking last year’s growth numbers to some average of the last few years’ performances.
Since different industries have different growth potentials, there is no standard PEG number which can be used to compare companies in different industries. But generally, as explained above, any PEG less than 1 is considered a good and vice versa
Relevance and Uses
The main purpose of the PEG ratio, as discussed above, is to determine whether a stock price is over or undervalued based on the growth of the business. In other words, it tells us is it worth investing in a stock irrespective of what price it is trading right now. The reason is that stock prices, as we know, are highly volatile and influenced by what are investor expectations, demand, etc. A company which is not doing well can have a high stock price because investors are creating false demand and pushing the price up. Below mentioned are few points to summarize PEG ratio formula:
- The PEG ratio enhances the P/E ratio by adding a growth into the calculation.
- It is used as an indicator of a stock’s real value. Lower PEG means a stock is undervalued and vice versa.
- Different growth estimates taken into consideration can result in different PEG for a given company
In nutshell, PEG ratio formula is a metric which investors can use to gauge whether the stock which has high-growth may be undervalued, even if they don’t appear so with the more common P/E ratio.
PEG Ratio Formula Calculator
You can use the following PEG Ratio Calculator.
| Price per Share | |
| Earning per Share | |
| Growth rate of Earnings | |
| PEG Ratio Formula | |
| PEG Ratio Formula | = |
|
|
Recommended Articles
This has been a guide to PEG Ratio formula. Here we discuss How to Calculate PEG Ratio along with practical examples. We also provide PEG Ratio Calculator with downloadable excel template. You may also look at the following articles to learn more –
