Updated May 15, 2023
Overview of Nifty PE Ratio
PE Ratio denotes how cheap or expensive a specific index is and here we are talking of Nifty 50. PE ratio tells us how much money an investor is willing to put in to earn a rupee as profit. So if the PE ratio of Nifty 50 is 20 for example, it means that an investor has to put 20 rupees on that index in the form of trading to earn a rupee as profit.
Nifty 50 PE ratio is a measure of the average price to earnings ratio of 50 companies covered under the Nifty index. This is also stated as price multiple or earnings multiple. Nifty PE ratio is measured by taking the sum total of the entire market capitalization of Nifty 50 companies and dividing the resultant with the sum of earnings of the same 50 companies under the Nifty index. To be specific it gives us the measure of how expensive the market is at any given point of time.
Analysis with Nifty PE Ratio vs Nifty Chart
When the Nifty 50 index rises, the Nifty PE is also bound to rise. Except for the period between 2007 and 2011 when the market was over-valued and Nifty PE crossed 25 points, the market fell and Nifty went down. Nifty PE is an important measure because it gives the valuation measure of all companies under Nifty. When we have low Nifty P/E it is an ideal scenario for buying and going long. A high PE of Nifty, on the other hand, is an expensive buy and demands caution before taking any investment decision.
Thus when PE ratio goes high, Nifty also tends to rise high. From the chart, it is clear Nifty suffers a sharp sell when PE goes really high like 25-30 and in a similar way Nifty sees more of buys when PE falls at an estimate of around 12-15. Investors should never judge the market by mere index point of Nifty or Sensex because it makes no sense as they are only aggregate numbers.
One needs to take into consideration the EPS generate from all the constituent shares of Nifty 50 before reaching a sound investment decision. How cheap or expensive the index is should be based on the PE ratio of the index and not on the value of the index. Any event when the Nifty PE is less than 12-15 it is a screaming buy situation and when Nifty PE is within 25-30 level it is a screaming sell situation.
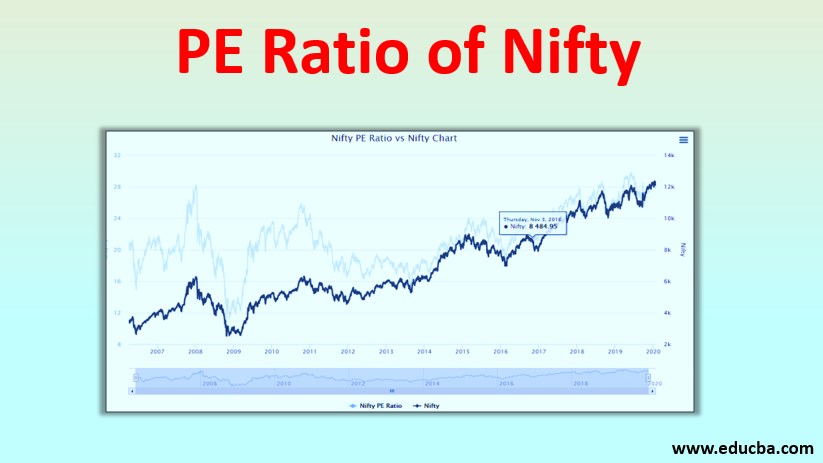
Nifty PE Ratio vs Nifty Chart
Here we discuss the Nifty PE Ratio vs Nifty Chart
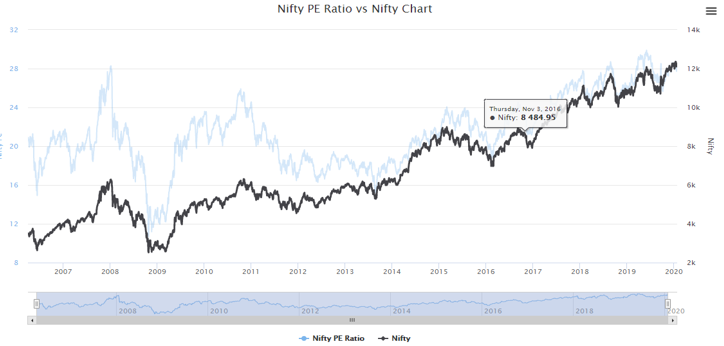
Source Link: www.equityfriend.com
The above chart shows us the plotting on the graph between the Nifty 50 chart and the Nifty 50 PE ratio. From the graph, it is very clear that the Nifty and Nifty PE ratio follows a similar kind of trend and is directly proportional to one another. When the over Nifty 50 index rises, the Nifty PE is also bound to rise. Except for the period between 2007 and 2011 when the market was over-valued and Nifty PE crossed 25 points, the market fell and Nifty went down. Nifty PE is an important measure because it gives the valuation measure of all companies under Nifty. Any event when the Nifty PE is less than 12-15 it is a screaming buy situation and when Nifty PE is within 25-30 level it is a screaming sell situation.
Price Investing using PE Ratio Nifty
The price to earnings ratio is an estimation of the present share price of the company compared to the earnings per share of the share. The more the ratio, the more is the amount the investor is willing to pay for a rupee of the current earnings. Thus a stock with higher PE has a tendency to increase its value whereas a share with low PE may be doing well or it may be undervalued.
We can look for PE of individual stock and invest in the market but people generally tend to have a check with the PE value of the entire market or the index. Here we are more concerned about the Nifty PE ratio, Investors will generally consider the market or index as overvalued when the PE ratio of the same index is above average and in a similar way consider it to be undervalued when the PE ratio of the index is under its average value.
Nifty PE is an important measure because it gives the valuation measure of all companies under Nifty. Any event when the Nifty PE is less than 12-15 it is a screaming buy situation and when Nifty PE is within 25-30 level it is a screaming sell situation. Anything in range 20-25 is considered expensive and it is advisable to book 80% of the profit and wait for a better position to make an entry.
Anything in range 15-20 is considered average and one can either buy or hold in such scenarios. As states above anything below 15 is a must buy scenario for the investors and something going below 12 is a rare event and is for sure a must buy scenario as the market is expected to climb in near future.
Importance
The following can be considered as the importance of Nifty PE ratio:
- Nifty 50 PE ratio is a measure of the average price to earnings ratio of 50 companies covered under the Nifty index.
- It gives a measure of valuations of all companies under the Nifty 50 index
- It is one of the most efficient buy/sell indicators which investors rely on.
- It helps in value investing as an investor buys more shares when the number reaches below 15 and tend to avoid buying when the number crosses 22.
Conclusion
Nifty PE ratio is an important measure which modern investors rely upon for their buy/sell decision. It gives a measure of the average valuation of the index and also helps in value investing. The zone where to buy or hold or sell is what the Nifty PE ratio provides an investor with simply by determining a number.
Recommended Articles
This is a guide to the PE Ratio of Nifty. Here we discuss the overview and importance of the nifty pe ratio along with the nifty pe ratio vs nifty chart. You may also look at the following articles to learn more –
