Updated July 29, 2023
Mean Formula (Table of Contents)
Mean Formula
The mean, also known as the arithmetic average, is a statistical measure used to determine the center of a dataset. It is calculated by summing all the data points and dividing the sum by the number of data points in the set. The mean plays a fundamental role in data analysis and is a common method for measuring central tendency.
When the population dataset is too large to analyze directly, a sample is often taken from the population, and the average of the sample is called the sample mean. This sample is considered representative of the larger population. It’s important to note that the mean value falls between the maximum and minimum values in the dataset but may not coincide with any specific data point.
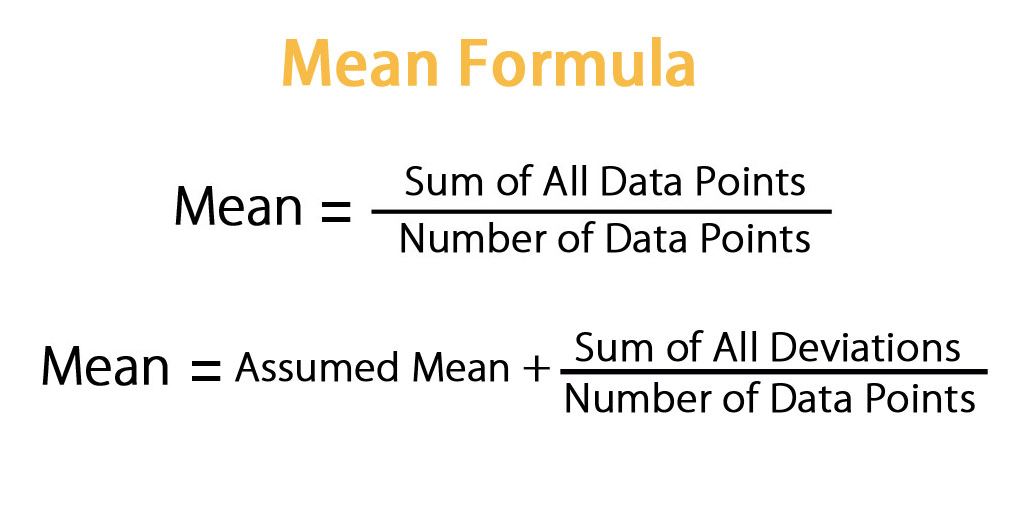
A formula for Mean is as below:
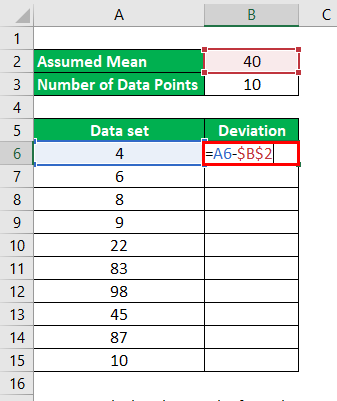
In the Assumed Mean method, which is not commonly used, one selects a random value from the dataset and assumes it to be mean. Then, one calculates the deviation of the data points from this value to determine the mean.
Examples of Mean Formula (With Excel Template)
Let’s take an example to understand the calculation of the Mean formula in a better manner.
You can download this Mean Template here – Mean Template
Example #1
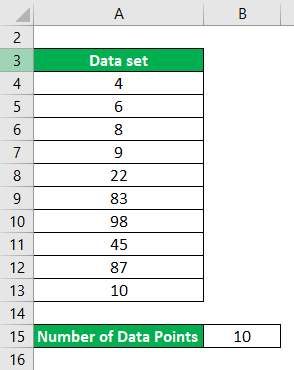
Let’s say you have a data set with 10 data points, and we want to calculate the mean for that.
Data set: {4,6,8,9,22,83,98,45,87,10}
Solution:
Mean = Sum of All Data Points / Number of Data Points
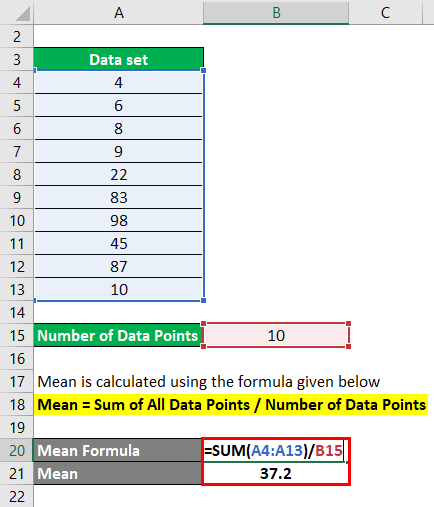
- Mean = (4+6+8+9+22+83+98+45+87+10) / 10
- Mean = 372 / 10
- Mean = 37.2
Let’s use the Assumed Mean method to find the mean in the same example.
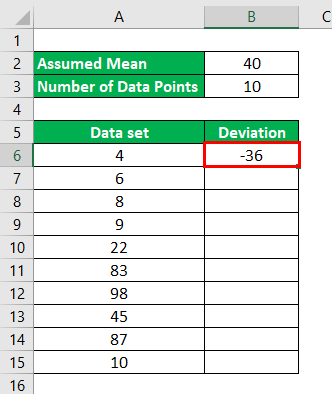
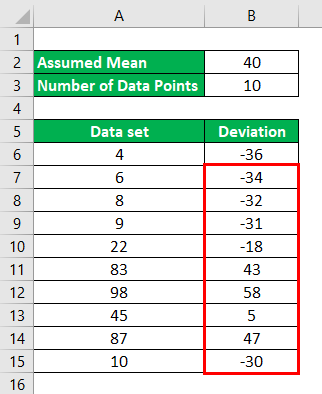
Let’s assume that the mean for the given data set is 40. So Deviations will be calculated as:
For 1st data point, 4 – 40 = -36
The result will be as given below.
Similarly, We have to calculate the deviation for all the data points.
Mean = Assumed Mean + (Sum of All Deviations / Number of Data Points)
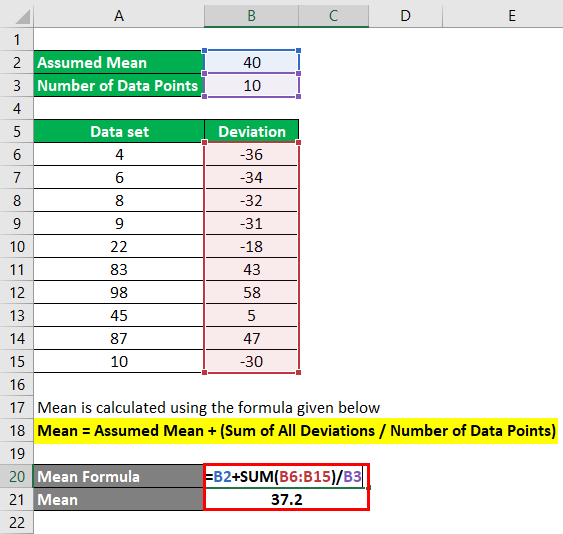
- Mean = 40 + (-36 -34-32-31-18+43+58+5+47-30) / 10
- Mean = 40 + (-28) / 10
- Mean = 40 + (-2.8)
- Mean = 37.2
Example #2
Let us take IBM stock and we will take its historical prices from the last 10 months and will calculate the annual return for 10 months.
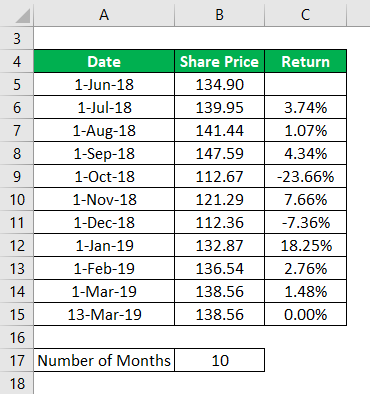
Source Link: https://in.finance.yahoo.com/quote/IBM/
Solution:
Mean = Sum of All Data Points / Number of Data Points
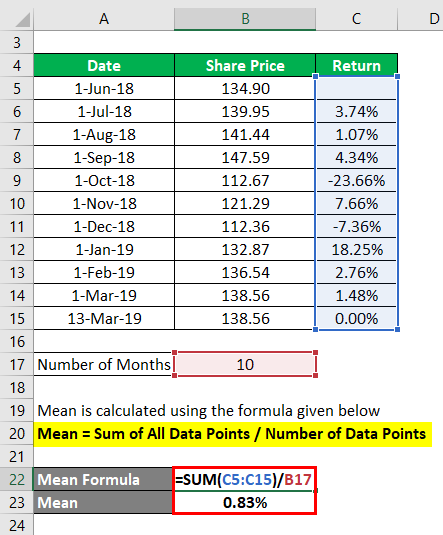
- Mean = (3.74% + 1.07% +4.34% + (-23.66)% + 7.66% + (-7.36)% + 18.25% + 2.76% + 1.48% + 0.00%) / 10
- Mean = 8.28% / 10
- Mean = 0.83%
So if you see here, in the last 10 months, IBM’s return has fluctuated very much.
Overall, the average return in the last 10 months is only 0.83%.
Explanation
Mean is a simple average of the data points in a data set and helps us understand the average point. But there are certain limitations to using mean. The mean value is easily distorted by extreme values/outliers. These extreme values can be very small or very large, which can distort the mean. For example: Let’s say we have returns of stock for the last 5 years given by 5%, 2%, 1%, 5%, -30%. Mean for these values is -3.4% ((5+2+1+5-30)/5). So although the stock has provided a positive return for the first 4 years, we have an average negative mean of 3.4%. Similarly, if we have a project for which we analyze the cash flow for the next 5 years. Let’s say the cash flows are: -100, -100, -100, -100, +1000.
The mean is 600 / 5 = 120. Although we have a positive mean, we are only getting money in the last year of the project, and it can happen that if we incorporate the time value of money, this project will not look as lucrative as it is now.
Relevance and Uses of Mean Formula
Mean is very simple yet one of the crucial elements of statistics. It is the basic foundation of statistical analysis of data. It is very easy to calculate and easy to understand also. If we have data set with data points scattered everywhere, the mean helps us see that data point’s average. For example: If a stock X has returns from the last 5 years as 20%, -10%, 3%, -7%, 30%. If you see, all the years have different returns. The mean for this is 7.2% ((20-10+3-7+30)/5). So we can now simply say that, on average, the stock has given us a yearly return of 7.2%.
But if we see mean in a silo, it has relatively less significance because of the flaws discussed above and is more of a theoretical number. So we should use the mean value carefully and not analyze the data based only on the mean.
Mean Formula Calculator
You can use the following Mean Calculator
| Sum of All Data Points | |
| Number of Data Points | |
| Mean Formula | |
| Mean Formula | = |
|
|
Recommended Articles
This is a guide to Mean Formula. Here we have discussed how to calculate the Mean, along with practical examples. We also provide a Mean calculator with a downloadable Excel template. You may also look at the following articles to learn more –
